
Messages Through Volatility
Last week, three conclusions stood out:
- In a market already characterized by weak participation and defensive internal leadership, depressed equity volatility created an asymmetric opportunity to hedge before volatility normalized.
- That view was supported not only by historical behavior, but more importantly by the statistical extreme developing in the spread between equity and rates volatility.
- The key question was not whether the spread could remain extreme, but which side was more likely to drive its eventual normalization.
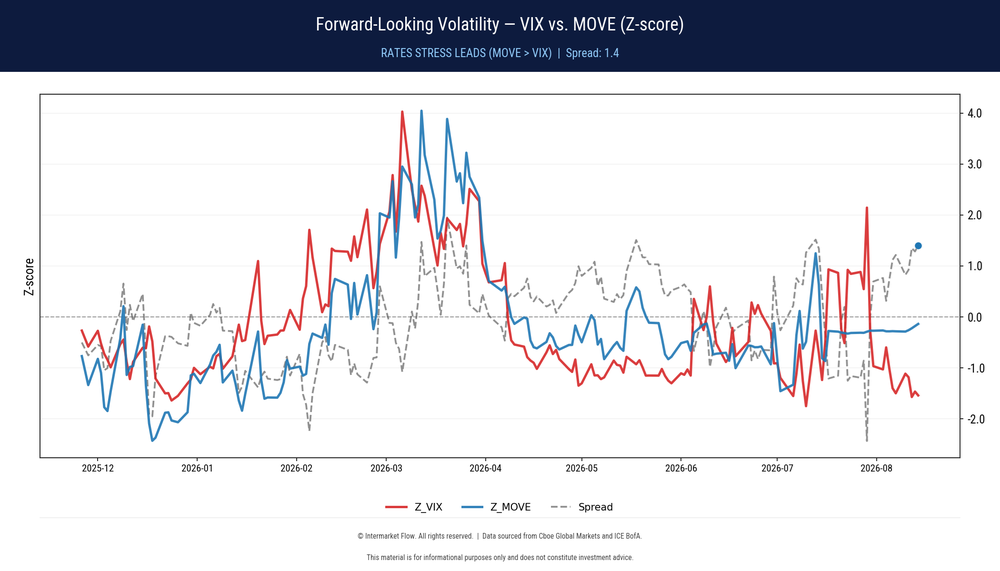
- Equity expected volatility has compressed toward a statistical extreme (red line), while expected rates volatility (blue line) remains much closer to its historical norm.
- This has produced the widest spread between the two volatility regimes observed this year.
- Because the extreme is concentrated on the equity side, normalization is more likely to require an upward adjustment in equity volatility than an equivalent decline in rates volatility.
Volatility Risk Premium
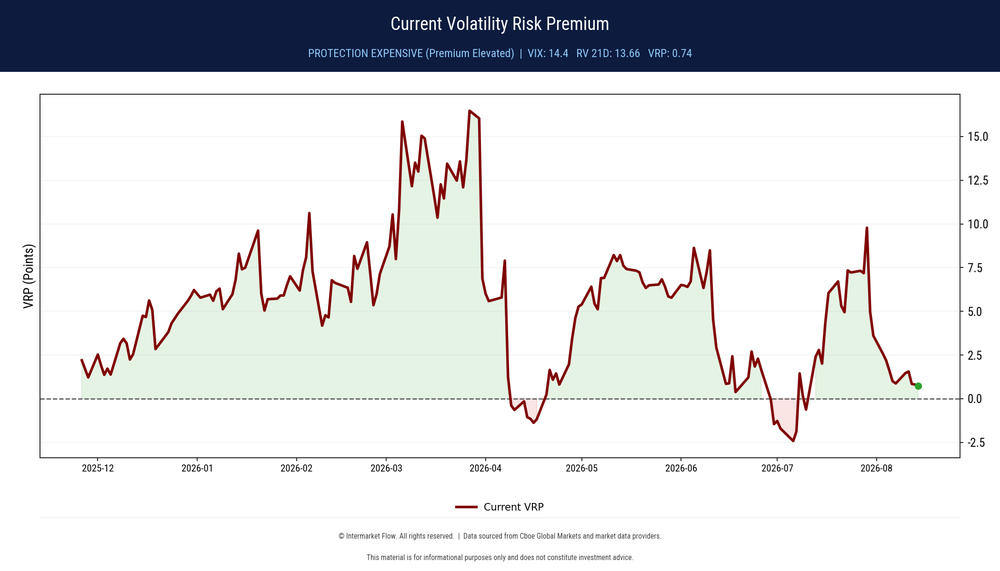
- The same compression has pushed the relative cost of equity protection toward historically cheap levels.
- Protection is therefore cheap precisely when the equity rates volatility spread is unusually stretched.
- This improves the asymmetry of the hedge because the cost of protection is low relative to the potential volatility normalization.
- Equity volatility is statistically compressed while the cost of protecting against its normalization is unusually low.
Risk Regime
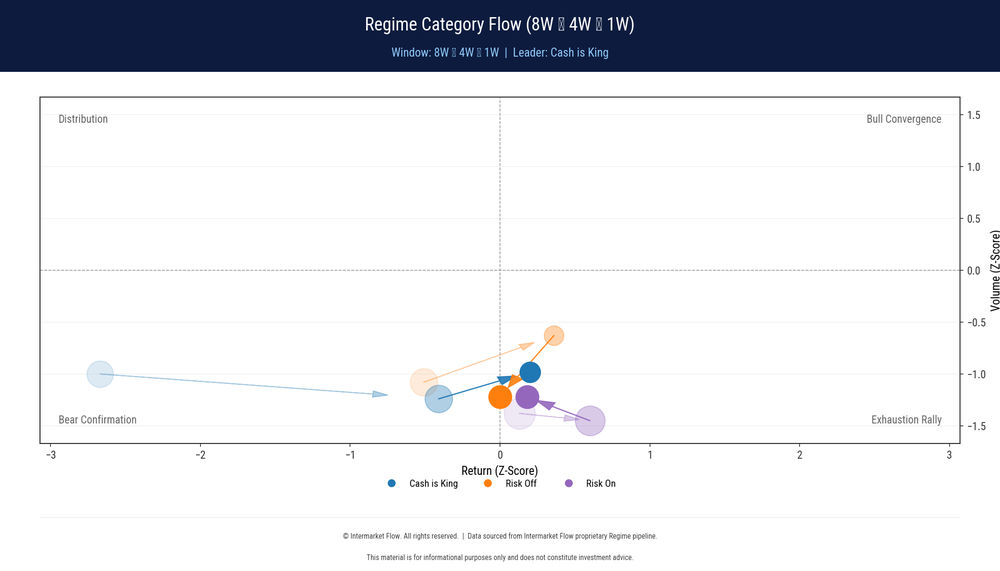
- Neither Risk On nor Risk Off is developing sustained directional follow through.
- Both continue to alternate between impulses and reversals.
- Cash Is King, however, shows greater persistence, allowing a Hands Out regime to progress while perceived equity risk remains exceptionally low.
- This regime’s evolution confirms the broader picture and is also a message in itself.
Where Volatility Is Compressing
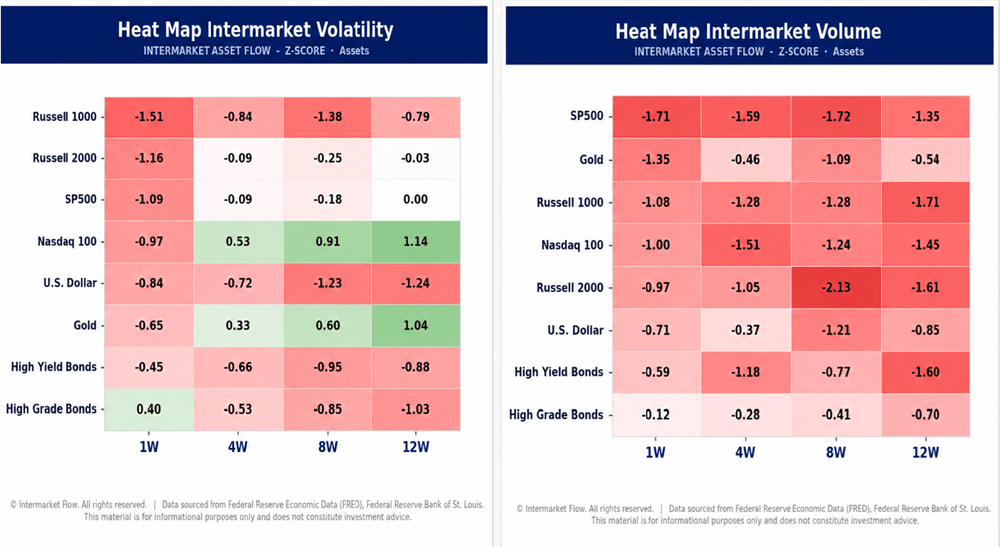
Volatility
- Compression is concentrated in Risk On assets. Nasdaq moves from +1.14σ at 12W to −0.97σ at 1W, while S&P 500 reaches −1.09σ, Russell 2000 −1.16σ, and Russell 1000 −1.51σ.
Volume
- Participation remains deeply below historical norms. At 1W, volume stands at −1.71σ for S&P 500, −1.08σ for Russell 1000, −1.00σ for Nasdaq, and −0.97σ for Russell 2000, with negative readings persisting across longer windows.
Combined Reading
- The important point is where volatility is compressing. The deepest compression is concentrated in Risk On assets.
- If volatility breaks higher, the potential adjustment is larger than it would be if compression were generalized across Risk On and Risk Off assets.
Conclusions
- There is a significant asymmetry in risk perception between equities and rates, with the statistical extreme concentrated on the equity side.
- Neither Risk On nor Risk Off has established sustained directional control.
- Cash Is King continues to progress in an environment of exceptionally low perceived risk and weak participation.
- At the same time, volatility compression is concentrated in Risk On assets. This increases the potential magnitude of the adjustment if volatility normalizes.
- Protection remains cheap. The time to buy it is before it is needed, because once volatility returns, the cost of protection will rise with it.
A Final Observation
The broader picture shows money markets sitting at or near absolute highs, with a large amount of capital effectively in Hands Off mode. That capital may appear distant from the current market structure, but its sheer size warrants caution. If it starts moving, it provides the fuel for a much more forceful and potentially disorderly repricing.Course of Action
- Reduce Long Directional Exposure: Cut or materially reduce outright long equity exposure while participation remains weak and structural flow confirmation is absent.
- Execute Asymmetric Hedges: Use OTM index puts or volatility-related optionality to take advantage of currently compressed protection costs in Risk On assets.
- Rotate Excess Capital Toward Liquidity: Keep excess capital in money-market or short-duration instruments while waiting for clearer regime confirmation.
- Monitor the Critical Divergence: Watch 1W volume and volatility closely. A sustained expansion in equity volatility, particularly if accompanied by renewed volume, would signal that the current low-volatility regime is breaking down.