#102 Capital Flows: The Credit Risk Awakening
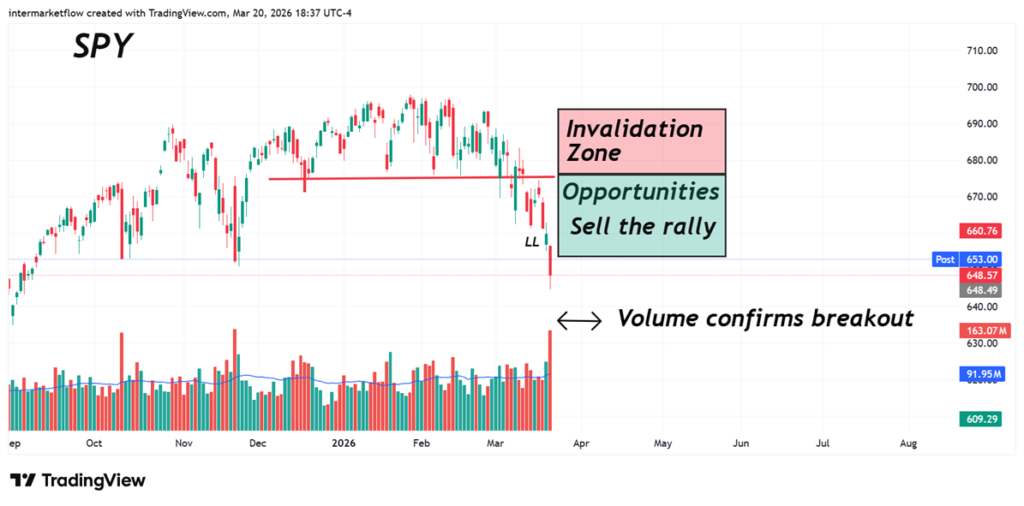
The market has pivoted from duration fear to credit panic. We analyze how Capital Flows are aggressively exiting junk bonds and equities to seek refuge in USD liquidity and crude oil. The record breakout volume in SPY validates the start of a new regime of extreme volatility.
#101 FOMC and Credit Risk: The Certainty Trap and the Threshold of Restriction – Copy
FOMC and Credit Risk: this is the decision the market must make—hard landing or an inflationary no-landing.
#94 The SOFR Breaking Point: Navigating the Dollar’s Structural Squeeze
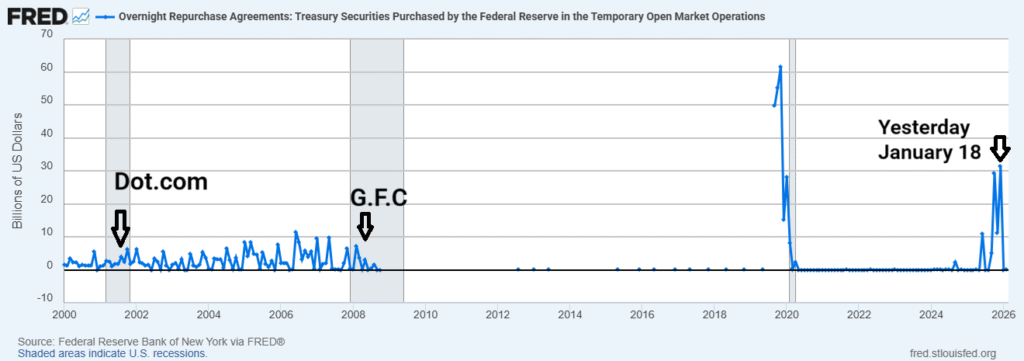
Liquidity has not vanished; it has been relocated. While the market is distracted by the “soft landing” narrative, the system’s plumbing is undergoing a structural stress that most are choosing to ignore. This report analyzes the critical transition from the Reverse Repo (RRP) facility into captive bank reserves and explains why the current growth model has officially entered a solvency trap.
#92 Market Capital Without a Destination
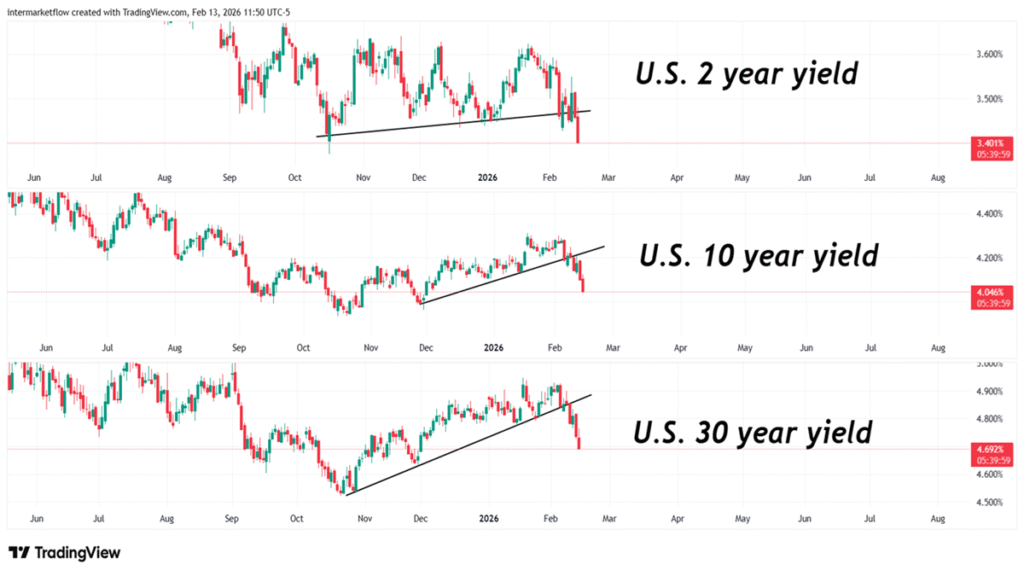
Market capital has gone on strike. Yields are in technical capitulation across the entire curve, yet equities refuse to rally—an arithmetic paradox that confirms a Hard Landing. As liquidity retreats to the system’s plumbing, the XLF breakdown signals a regime shift. Patience is not optional; it is your only edge.
#89 New Orders: Nominal Strength, Real Weakness
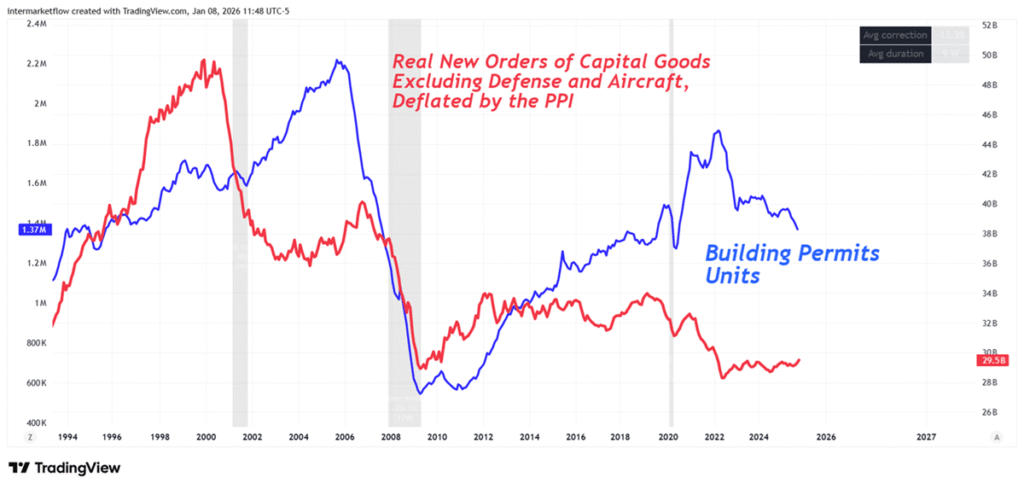
New orders can be misleading. We analyze the nominal trap through building permits and intermarket, intramarket and speculative capital flows.
#87 Intermarket Flows and Early-Year Market Signals
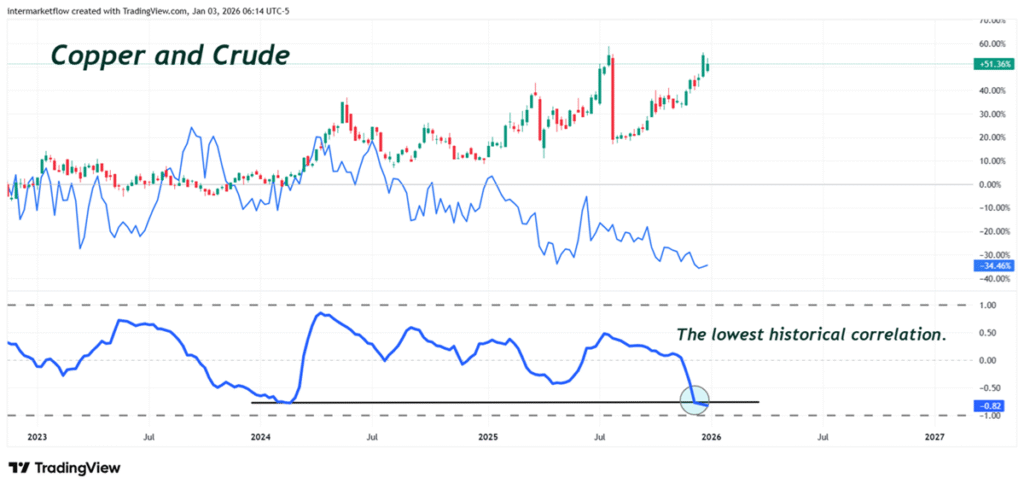
Intermarket Flows: We analyze capital outflow and inflow hubs, seek risk-efficient operating environments, and examine currencies and commodity-intensive economies.
#86 Macroeconomics, rates and the Automotive Sector
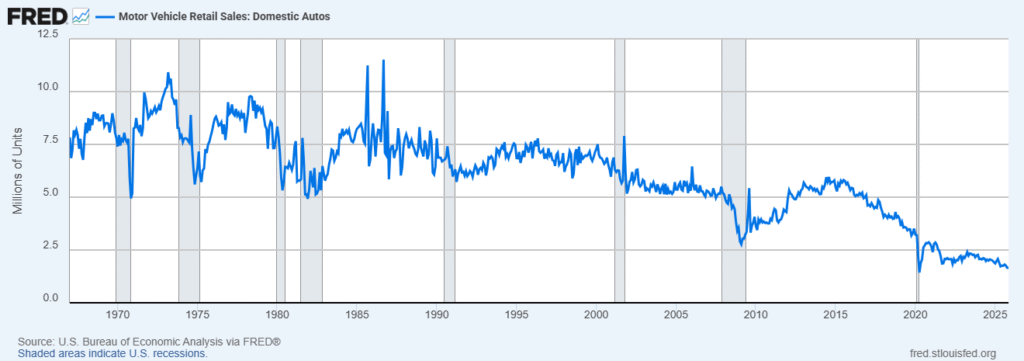
We analyze the evolution of auto credit and vehicle sales, and how short-term interest rates directly impact demand. We place today’s sales levels in historical context and examine five vehicles within the auto retail sector.
#84 The discretionary delusion and the market’s stance. Three vehicles to track.
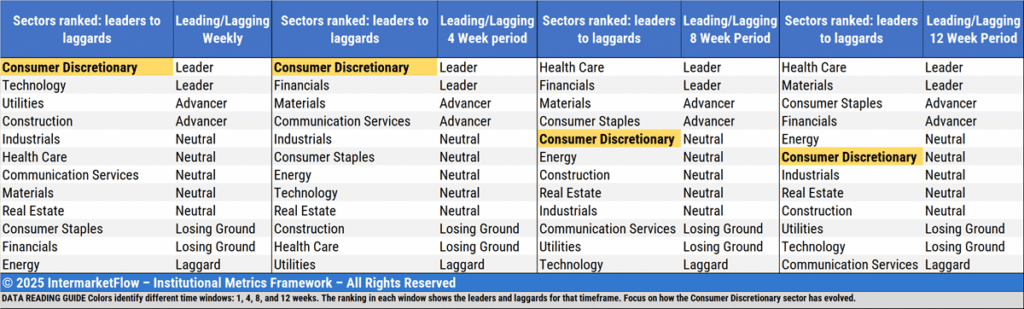
We break down retail sales and why Consumer Discretionary is completely detached from reality. We picked three vehicles to go deeper, while tracking how risk-takers positioned themselves this week.
#83 Unemployment, Macro Cycles and Sectors
A historical perspective on unemployment—its levels and the current trend relative to past cycles. Its connection to sectors, and how sector leadership evolves as the cycle matures. We then zoom in on two sectors in search of vehicles to trade.
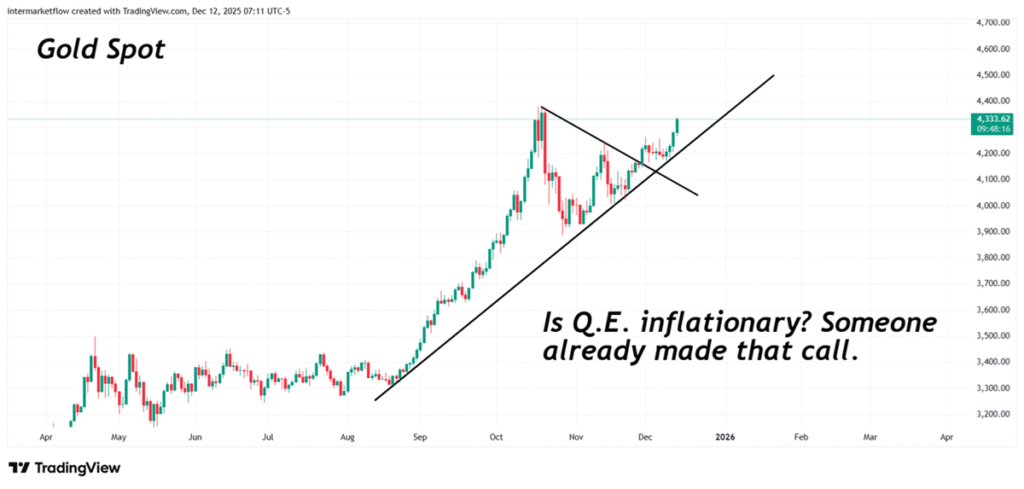
#82 QE and inflation. A popular debate with no real substance
QE and inflation is one of the most popular debates in macro—and one of the most misunderstood. In plain language, QE is the Fed buying bonds and paying with bank reserves: they hit “enter” and reserves show up on a bank’s account at the Fed. The real question isn’t whether that money “exists.” It’s what the second-round effects are—especially when QE ends up supporting the Treasury market that finances the fiscal deficit.