#74 Complete Technical Set Up for the Home Builders Sector-Nov 26
A complete technical analysis covering all branches of technical study: trend, time, volume, mean reversion, and charting.
#73 The Real Economy and the Markets
The flip side of the fiscal deficit is a constant injection of liquidity into the system. It’s the fiscal leg of monetary policy—and it depends on the administration in charge.
#72 Liquidity and the Plumbing of the Monetary System
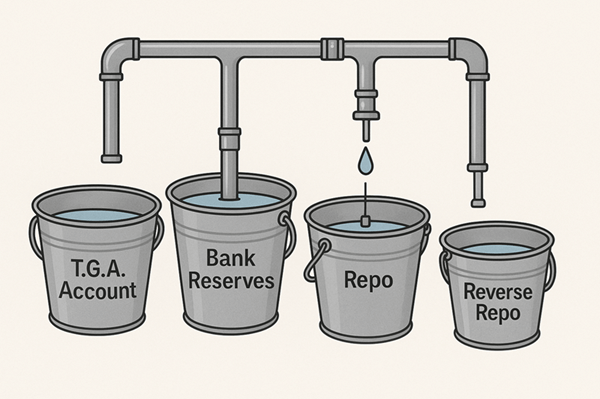
The system of liquidity injection and extraction in the real economy. Explained in a simple and understandable way.
#71 Dot-com and G.F.C: similarities and differences with the current situation
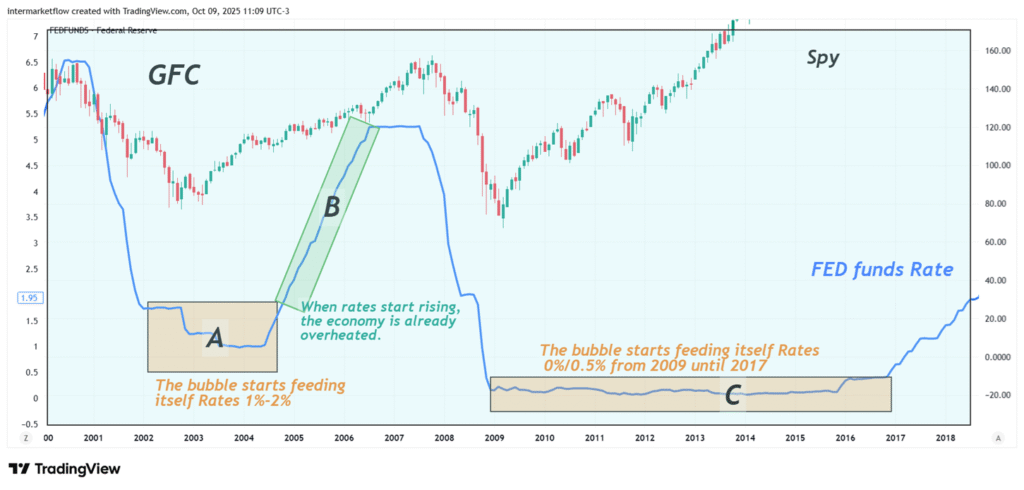
The current situation: Similarities and differences with the GFC and the Dot-Com crisis.
#70 The Residential Market
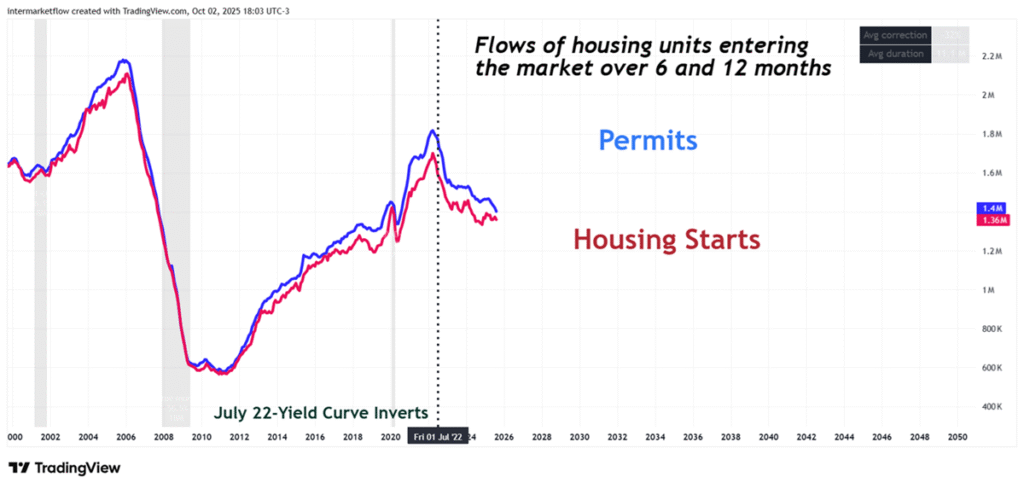
We seek to understand the relationship between the new and the existing home market—the different flows and inventories that shape both. We analyze how imbalances in one market affect the other.
#69 PPI, Commodities and the Dollar
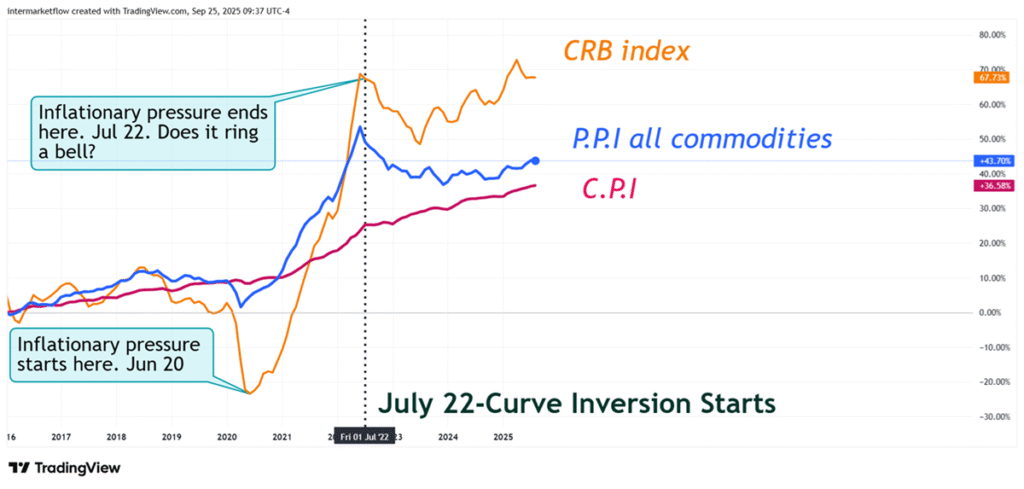
The PPI, Commodities and the Dollar are closely linked, shaping several key macro variables. We examine how this interaction impacts yields, particularly the 30-year yield, and inflation expectations.
#68 Spot federal rate spread vs. PCE inflation rate
We analyzed the intermarket capital flows that took place in the week of September 17, following the rate cut. We looked at the effects they generated, where they occurred, and with what volume. We searched and found where the volume moved that week.
#67 Labor Market and Consumption
The connection between consumption and the market may seem direct. It isn’t quite so since the state has also intervened in this market. Here we explain the market’s causalities. We break down Nonfarm Payroll to show why it fails as a true measure of employment, and finally, we lay out a concrete technical setup.
#66 Banking System and Credit
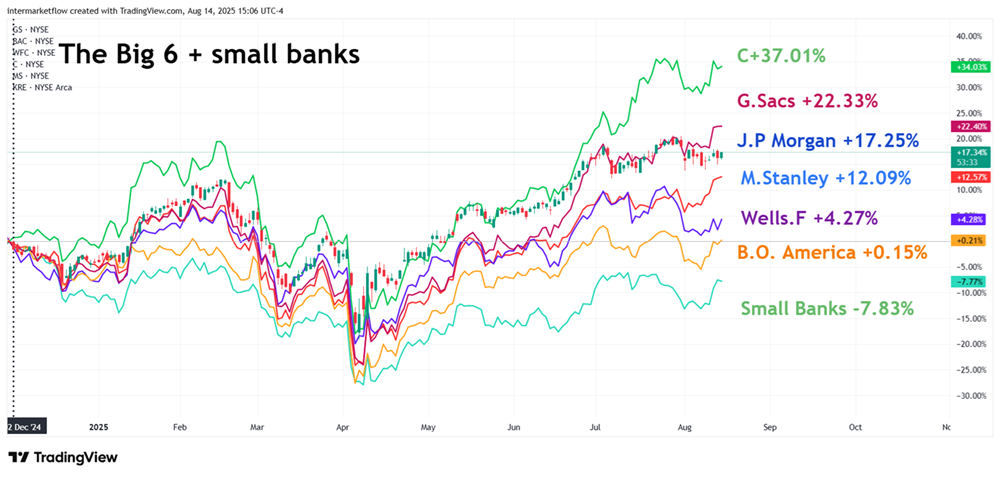
To analyze which banks are most exposed to consumer credit delinquencies, the most useful approach is to break down their business units and assess the weight of consumer lending within each balance sheet. Here’s a summary bank by bank (based on 10-Ks, Fed H.8 data, and 2023–2024 reports):
#65 Jackson Hole Reactions, Rate Cuts and the Intermarket
We analyze the intermarket moves that took place after the Jackson Hole conference. We seek to identify where capital flowed.