Intermarket Sequence
To understand these charts, we need to recognize that this process did not start this week. It began three months ago. The events of this week and last week are not isolated—they are the natural continuation of an ongoing regime shift.
Weekly flows, across all dimensions—returns, volume, volatility, and dollar value—define the structure of the move. Through the heatmaps, we identify the personality of these flows across timeframes and, more importantly, the sequence behind them.
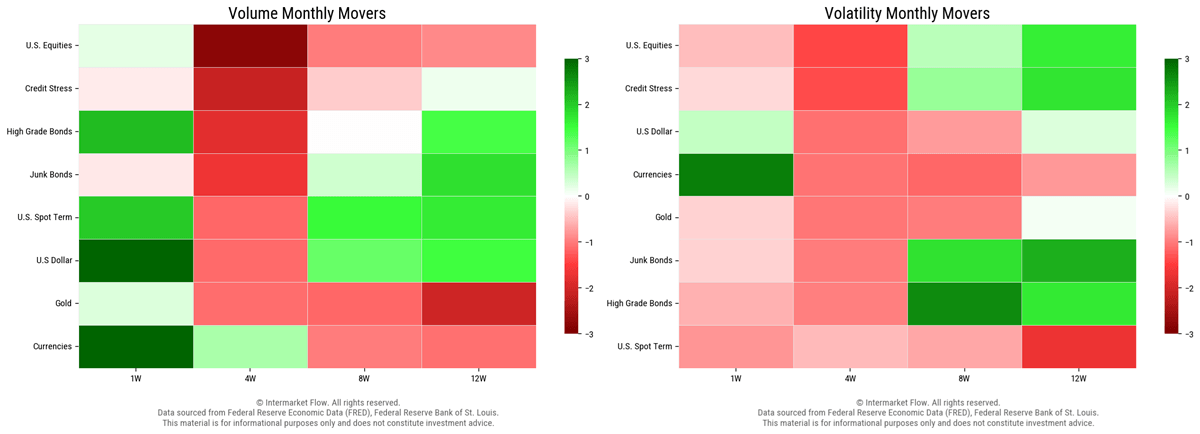
Structural Regime Break
This analysis is anchored in the 8–12 week window. What we are seeing today is the final stage of a process that has been developing for months.
12W–8W: Structural Decay
This is where the system started to fail.
Credit stress led the move. Volatility in credit expanded 12 weeks ago and remained elevated through the 8-week window. This was the first signal of instability.
High-grade bonds followed. Volatility increased early, signaling the breakdown of the traditional safe-haven role of duration.
Equities confirmed the fragility. Volatility was already elevated 12 weeks ago, even before capital started to exit. The market was unstable before it became illiquid.
This phase represents structural deterioration. The cost of capital and debt stress broke the growth narrative.
4W: Institutional Exit
The 4-week window validates the transition from stress to action.
Equities moved into clear distribution. Volume turned decisively negative, confirming institutional exit.
Fixed income lost its defensive role. High-grade bonds transitioned from rebound into contraction and stopped absorbing flows.
High-yield credit deteriorated further. Negative volume and unstable positioning confirm that credit risk is no longer being transferred—it is being rejected.
This is no longer fragility. This is capital leaving the system.
1W: Terminal Liquidity

The weekly timeframe reflects the final stage: the search for liquidity in different assets.
The yen moved aggressively into expansion, with extreme Z-activity. This reflects a flight to quality and the unwind of carry trades.
The dollar acts as a transitional asset. It absorbs flows but does not retain them. Capital is moving through it, not into it.
Gold is the only asset absorbing inflows. It is not reacting—it is being accumulated.
This is not rotation. This is capital seeking safety.
Macro Floor: PCE and Real Rates
The macro constraint is defined by real rates. On Thursday, the March 2026 P.C.E came in at 3.5%. As we all know, this is the Fed’s preferred measure of inflation.
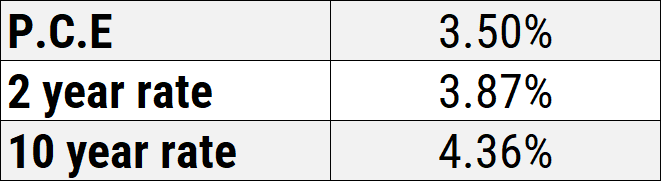
The snapshot is straightforward. PCE at 3.50%. 2-year at 3.87%. 10-year at 4.36%.
Real rates are positive but compressed: ~0.37% on the front end and ~0.86% on the long end.
This is not restrictive. It is a low level that loses its ability to anchor the system if inflation stops declining. The structure is fragile.
The Fed is on hold and inflation is not converging fast enough.
With nominal rates stable, any stabilization or re-acceleration in PCE mechanically pushes real rates toward zero and then negative. There is no need for rate cuts. If inflation simply stops falling, real rates turn negative. That is the critical point where market behavior shifts.
Capital does not “anticipate” in the abstract — it repositions. And that repositioning leaves a measurable footprint.
Operative Conclusion
Signal
The regime break was initiated by the 12-week volatility expansion in credit and bonds.
Validation
The 4-week negative volume in equities confirms institutional exit.
Reading
The market has transitioned from pricing growth to managing liquidity.
Action
Risk-on exposure should be reduced to zero.
Mandate
Short equities. Long gold. Long JPY. Underweight nominal debt. High-grade bonds no longer provide protection under current conditions.
Trading
We include some of the charts we are analyzing for the Wednesday report. These are trades designed to capitalize on negative real interest rates.
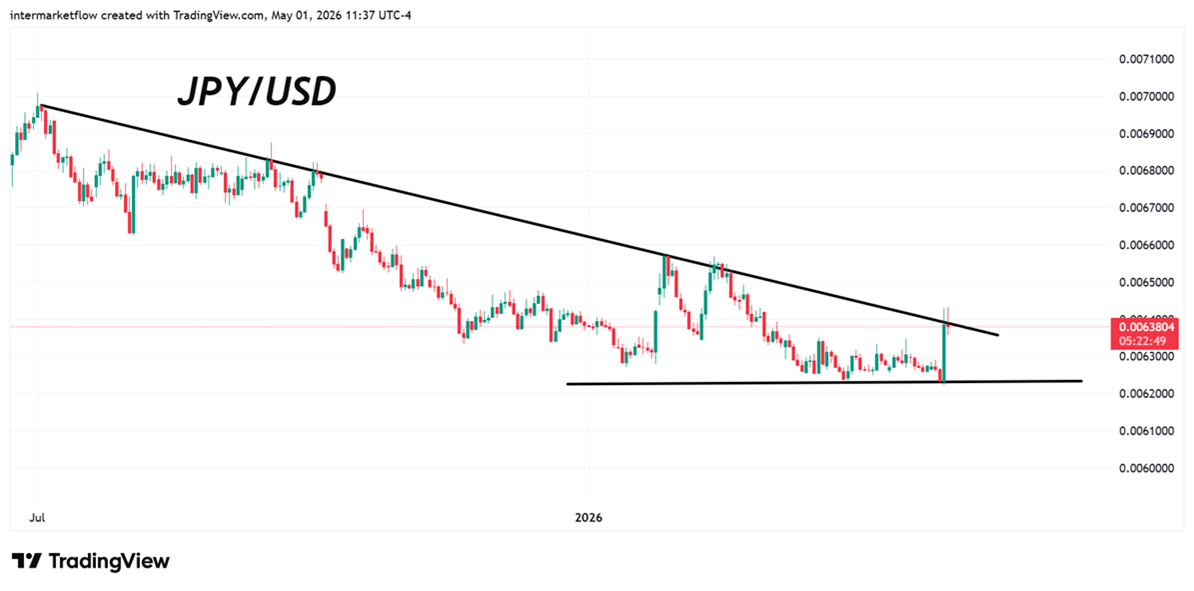
There is a lot of talk about the yen carry trade, but few truly understand it (more on this here). Participants in this trade who do not hedge the exchange rate are highly exposed to yen appreciation. Just as yen depreciation boosted returns in the past, appreciation now erodes them. This can generate selling pressure in both equities and bonds.
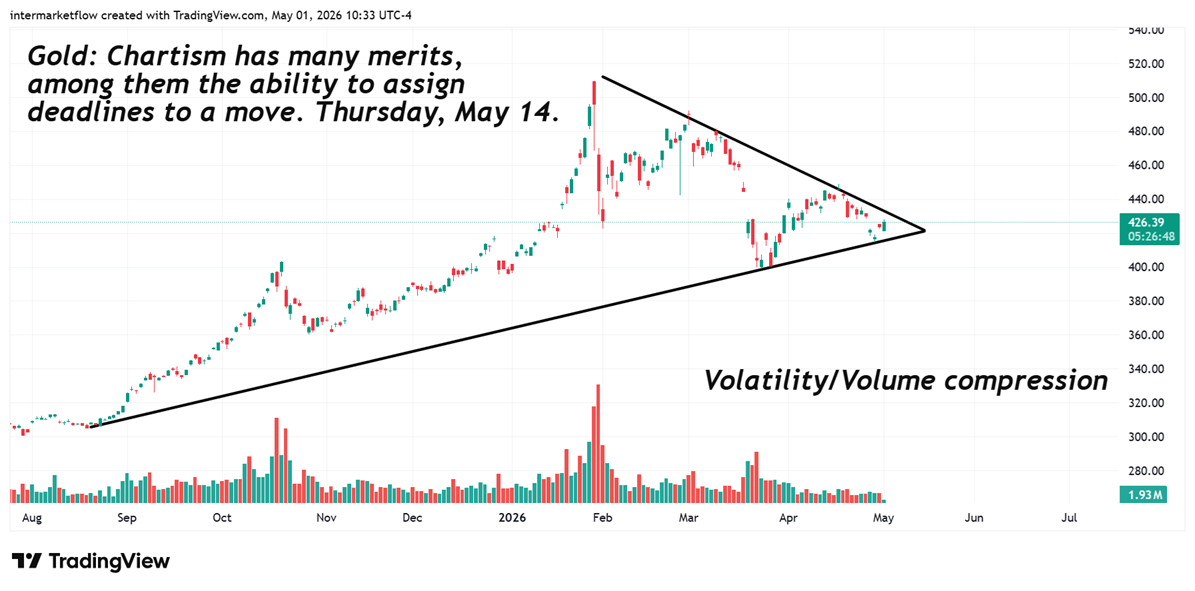
In a negative real rate environment, gold is the primary destination for capital.
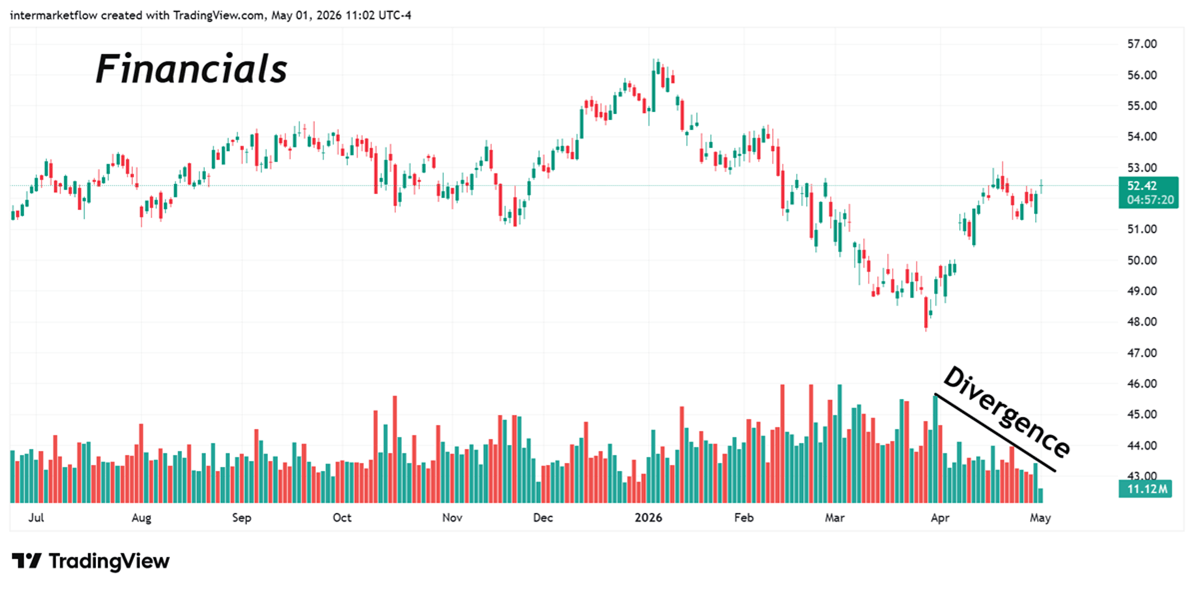
In a negative real rate environment, banks’ loan books become like ice cream in the middle of the Sahara. This adds another layer of risk to an industry already burdened with unresolved issues that the market has yet to fully price in.
Intermarket Flow
If you believe this is an error, please contact the administrator.