- The real economy and the context we are trading today.
- The VIX: a historical perspective on current levels, with a specific comparison to the Dot-com and GFC recessions.
- The real economy and divergent reactions within the financial and homebuilding sectors.
- Intermarket flows: the same winners remain in control.
- Intra-market analysis: segmentation to see what headline data hides.
- The health of the AI trade.
- Sector-by-sector relative performance versus the S&P 500.
- Relative strength within the homebuilding sector, identifying specific vehicles.
- Home Depot and KB Home: wounded prey on the open plain.
The Real Economy: Winners, Losers, and Injured Players
The real economy is showing up in market prices. Despite flashy and misleading headlines, once you segment the data and dig beneath the surface, reality comes into view.
Year-end is here, and markets are trading thin. This is the perfect environment for false breaks, stop hunts, and other market “courtesies.” A part of navigating this context is interpreting price action with more skepticism.
Price levels reached on volume isn’t the same as one price hit during the Asian open, for instance, where markets are far more exposed—and in certain cases, even manipulable. It’s no coincidence that this is when large liquidity pools tend to move, which is why we call it the “witching hour.” Stop hunts and long wicks are the norm here.
This is the ecosystem we’re trading in

Today, a Fed pause is practically priced in. Looking at A, B, C, and D, we can see how this probability shifted as data hit the market. In this context, a seemingly extraordinary headline on Q2 GDP didn’t change the outlook. It’s reasonable to assume that positive news will trigger the same reaction: nothing.
In a rate-cut scenario, the potential is much higher. There is significant room for a repricing of cut probabilities—and therefore, of all prices. Meaning, terrible news could send markets surging. Labor markets’ bad reports are the most probable catalyst. This variable is the only one with enough power to shift today’s probabilities.
The stage is set

Expected volatility levels are now below those of the Dot-com bubble and the G.F.C. This is another major “achievement” of Q.E. that flies under the radar and falls outside the scope of this report. Regardless, at these levels, the stage is set for a shake-up. This is a quarterly chart to provide a historical perspective on the matter.
The real economy: Construction sector.
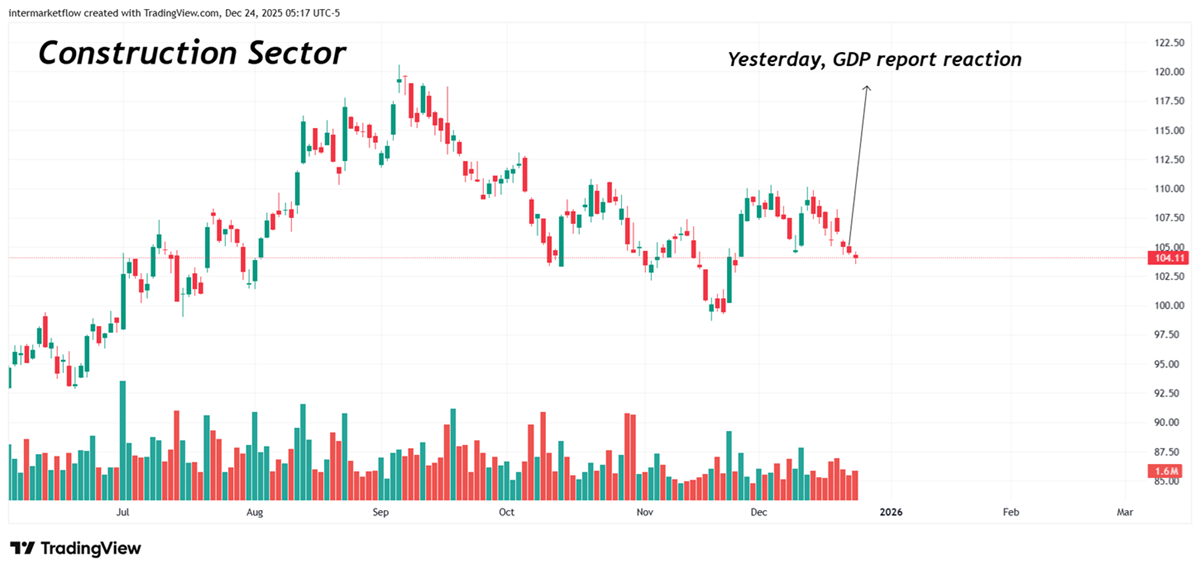
For the construction sector, the probability of a “no cut” rising or staying steady is terrible news. High rates, high mortgages, and the price of their primary asset through the roof—a business model that is increasingly broken. This market is already fractured, out of equilibrium no matter how you look at it. A return to equilibrium will happen either through quantities (unlikely under these conditions) or through prices—the most probable scenario.
Remember, this market—like that of all real assets—only goes up. Fiscal deficits are liquidity injections into the economy, and as they become larger, sustained over time, and with Q.E. ensuring their propulsion, everything rises. Houses, cars, stocks, gold, silver, crypto, memes, etc.—all at all-time highs.
Financial Sector

For the financial sector, a “no cut” scenario is good news. A core part of their business is the interest rate differential between deposits and loans (Net Interest Margin). Higher rates mean higher margins.
The week in the intermarket

Winners are shaded. Look at the abnormality of their returns. The z-scores indicate that returns are nearly 3 standard deviations away from their historical average. This is extreme, coupled with extreme volume in precious metals and high, rising volatility in both. This may be signaling the need for a pause.
Intra-Market
We are going to take a monthly perspective, widening the lens to see the forest for the trees. All of these stats are relative to Sp500. That way you can normalize data and make it comparable through z’s numbers.

Two real economies with clear winners and losers. Note that in the case of the winners—the second half of the table—returns are rising, but activity and volume are falling at extreme levels. In the losing sector, activity and volume are dropping, but at normal rates. The flow descriptions for each sector clarify the situation.
The real economy and A.I. trade health
Activity in this trade is falling at extreme levels, volume is doing the same, and volatility is exploding. In this context of an increasingly thin trade, returns remain positive, but the less visible components—such as activity, volume, and volatility—clearly speak of an exhausting trade.

Intra-sectors: A technical View on the construction sector, this time Home Depot


Clearly, looking at the technicals of the sector as a whole, there is a confirmed bearish signal. Of course, when we break down individual stocks, the micro comes into play. In this situation, inventory management, operating flows, and financing methods will play decisive roles. It is important to note that with the Fed accepting MBS at par, none of them face illiquidity risks. This is no minor point.
Construction Sector: Other Vehicules
Keep in mind, all of these numbers are relative to the company’s sector. In this particular case, the construction sector.

The real economy and KB Home in yellow
The flow description clarifies. Trading activity in the asset is extreme. So are volume and volatility. The exodus of players is growing at an increasing rate, but it has only just begun. This company is a wounded gazelle in the middle of a pride of lions.
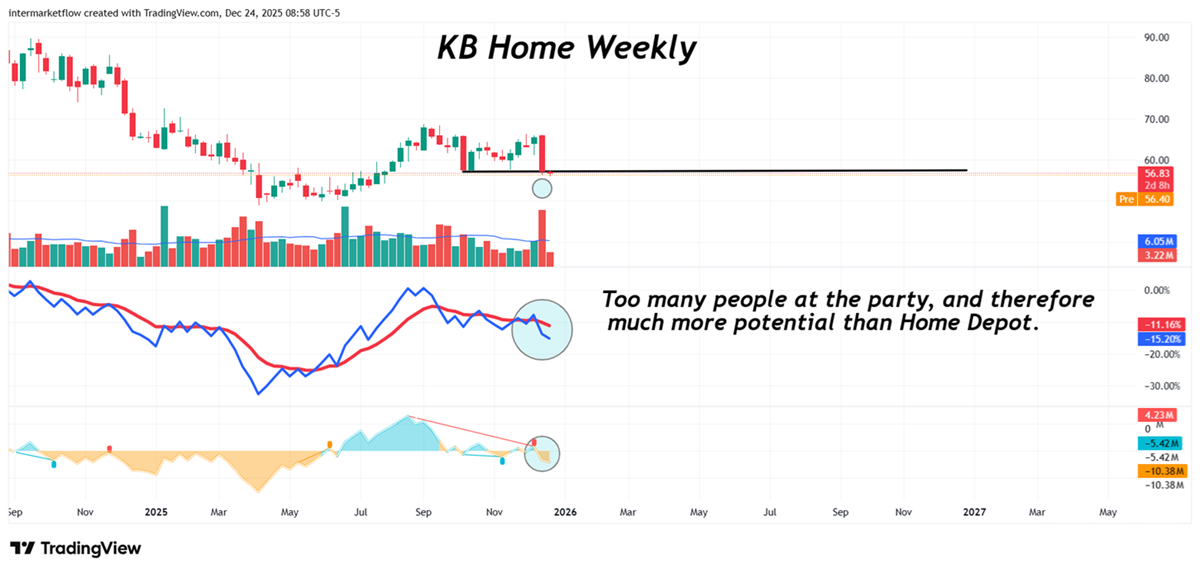

From a macro perspective, the risk of this trade is a disastrous labor report. On Friday, January 2nd, the payrolls will be published—a report with catalytic gunpowder.
Even so, this business model is broken; the constant injection of liquidity via fiscal deficits causes assets to only go up. These are zombie companies floating simply because liquidity problems have been eliminated at the macro level.
That’s all for this special time.
The service will not stop during the holidays or for New Year’s.
“Terrifying times” are coming
Time to turn off the screens and hug your loved ones… at the end of the road, it’s the only thing that matters.
Martin
If you believe this is an error, please contact the administrator.