In the residential market, we seek to understand the relationship between the new and the existing home market—the different flows and inventories that shape both. We analyze how imbalances in one market affect the other.
On a micro level, we examine the different capital structures of homebuilders and identify which are most exposed. Then we’ll move to the stats to track this week’s flows and wrap up with a full technical analysis of the sector.
The Residential Market
Both markets share the same origin when it comes to stock inflows. (A simple metaphor to grasp the entire residential market is to compare it to the market for new and used cars). Let’s take a look.
The Residential Market: Capital Inflows
The difference lies in the timing of these inflows into each market.
The new home market receives capital inflows roughly 12 months after construction begins. The existing home market, on the other hand, absorbs those flows 3 to 4 years later.
The Residential Market: Foot Note #1

The process shown in the previous chart has a counterpart. Job openings in the sector are collapsing. How can this be reconciled with companies in the sector rising in market value? Below the levels seen before the GFC.
The Residential Market and Intermarket Analysis – Foot note #2

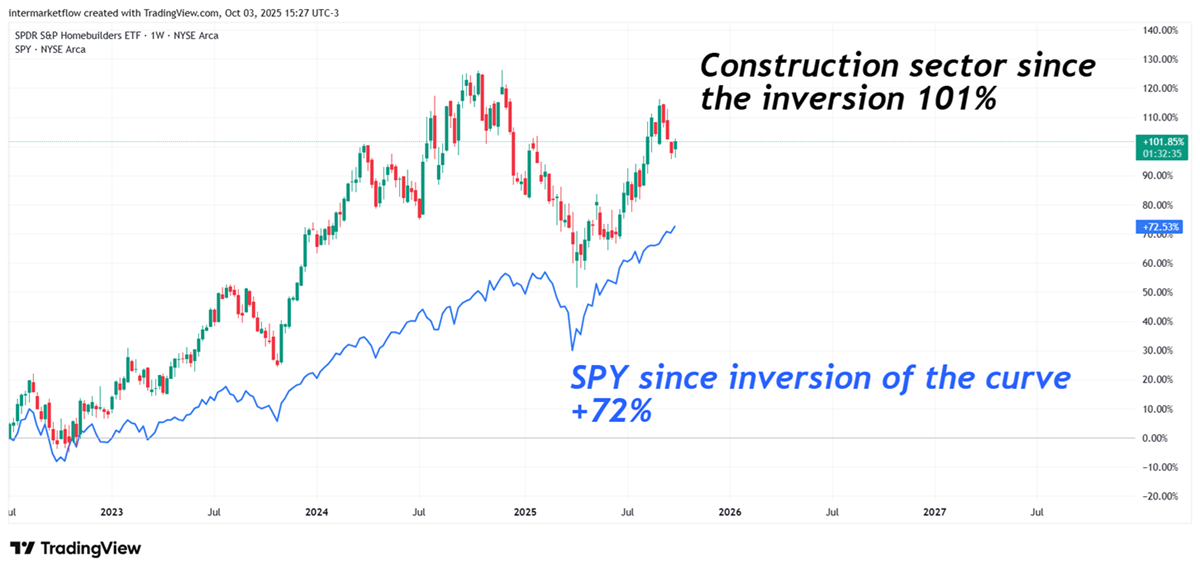
The construction market is a leading indicator of the economic cycle. Note its effectiveness in signaling recessions. With the exception of the dot-com bubble, it anticipated 6 of the last 7 recessions. While the sample size is small—just as recessions themselves are—the accuracy rate so far stands at 85%. If only we had more indicators like this.
The Residential Market and Capital Inflows – Supply
Capital inflows (supply) come from builders with different business models and capital structures. We’ll review these in the micro analysis. Still, they share one common trait: their benchmark rate is in the 2- to 5-year range. That segment of the curve directly drives their profitability and capacity to build.
The Residential Market and Capital Inflows – Demand
Homebuyers, in contrast, operate on the long end of the curve. The 30-year rate, which drives mortgage rates, guides their decisions. Both sides of the market are essentially playing different games.
This gap, reflected in the 2-30 spread, energizes or not, the market. From here stem ideas like anchoring long-term inflation expectations which are key for markets that rely on the long end of the curve
The Fed’s spot rate influences the 2-year yield but has zero control over the 30-year. That’s why we’ve seen, in the last weeks, the Treasury buy backs its own debt. This is yield control—a new game in town.
The spread affects both new and existing home inventories. Higher 30-year rates have a double effect: mortgage demand falls and the move from existing to new homes stalls. After all, who would swap a 3% fixed mortgage for a 7% variable one?
The Residential Market – New Home Inventory

Existing Home Inventory

The Residential Market: Adding Inventories
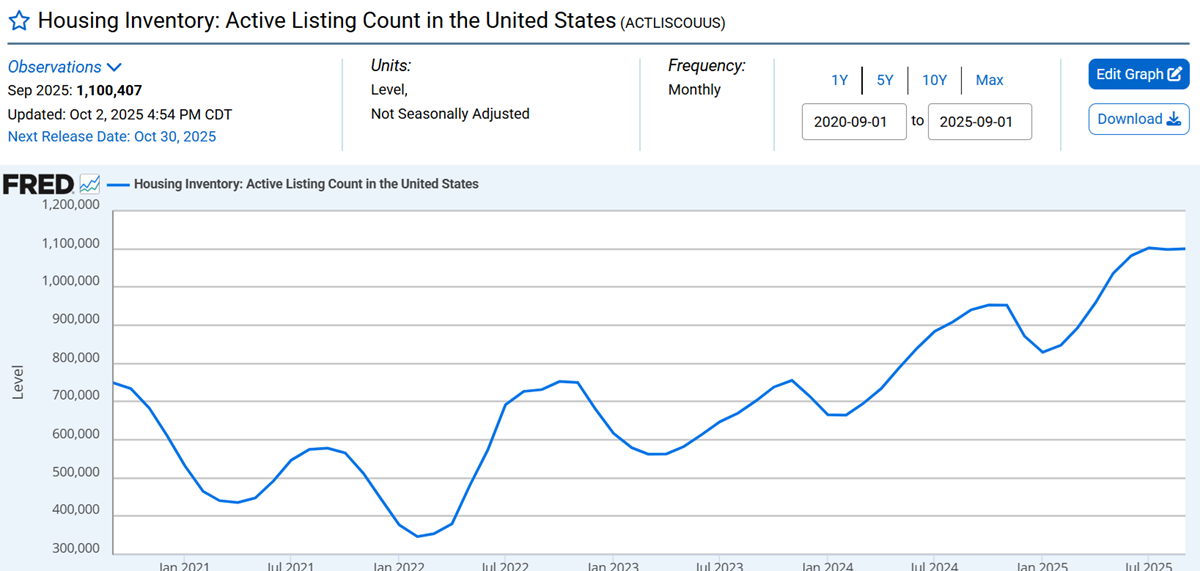
The Residential Market: Inventories
New home inventories are rising and remain at historically high levels. Existing home inventories, by contrast, are flat—neither growing nor falling. The market is frozen. As a result, aggregate inventories are increasing mainly on the new home side.
The Residential Market: Capital Inflows
As we’ve seen, inflows have been falling since July 2022, the moment the curve inverted. A decline doesn’t mean inventories stop growing, only that they grow at a slower pace. The relationship between inflows and inventories is well captured in the following chart.

The Residential Market and Demand Key Drivers


On the demand side, both main engines are shut down—mortgages and affordability.
What else can be expected from a market already carrying high inventory in both segments, other than a price and supply adjustments, given demand drivers are off?
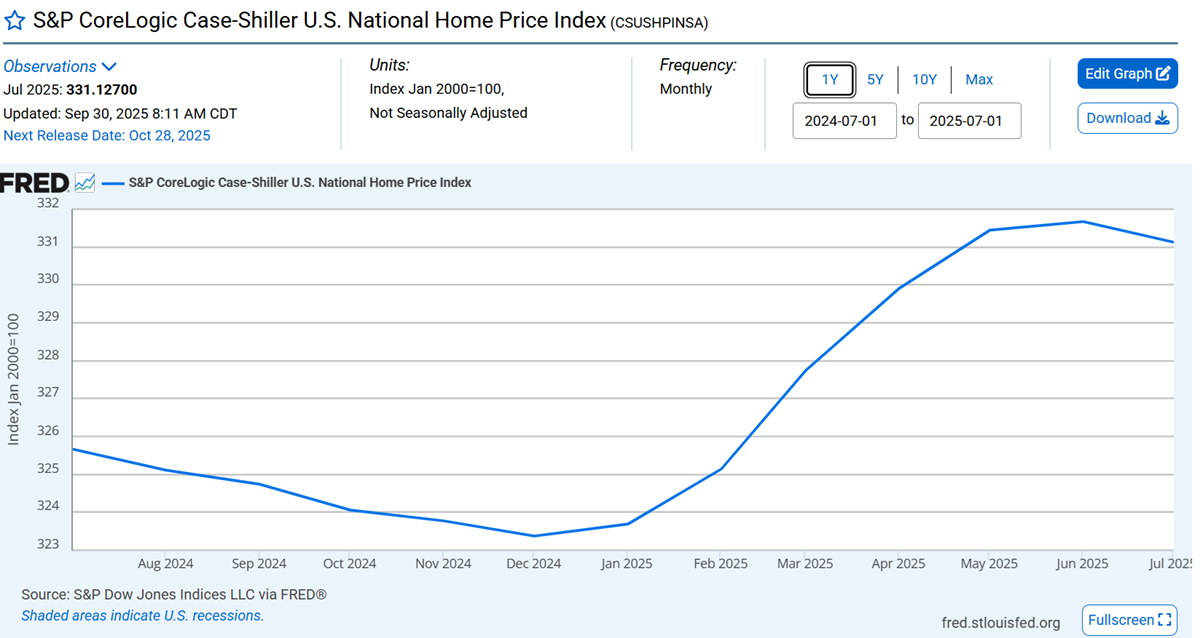
The adjustment in the housing market has already begun. As long as the other variables remain unchanged, price is the only lever left. The loss of value in new homes—and therefore in existing ones—is set to accelerate.
Dynamic Effects
- The drop in prices of existing home inventories hits household wealth. This has aggregate consumption effects that are very hard to measure today.
- The drop in prices of new home inventories impacts builders according to their capital structure and project financing.
The Residential Market and Capital Structures
Let’s outline the three main methods, while recognizing that in practice they exist along a continuous gradient:
- Classic: Buy land with own capital + obtain debt to build → develop → hold until final sale. This model is exposed to interest rate risk but especially to valuation risk on inventories.
- NVR: A model that does not buy land. Builders arrange purchase options with third parties, reducing both interest rate risk and inventory valuation risk.
- Joint Ventures: A flexible format involving financiers, capital funds, and even landowners. The main risk here is price declines.
In all cases, time works against them, and a frozen market amplifies all risks.
The Residential Market and Price Adjustments
The value of new properties can fall, but it has a natural floor set by the value of existing homes. In practice, that floor equals the value of existing properties minus financing differences.
This, of course, affects the balance in the existing market, whose floor is defined by the overhang of new home inventories. Only once that overhang clears and scarcity pushes new home prices higher will the floor in existing homes start to rise. These markets move in tandem.
The Residential Market: Market Analysis Through Price Dynamics

Zooming in….
The Residential Market: The construction sector
Financial Sector

Residential Markets vs Materials Sector

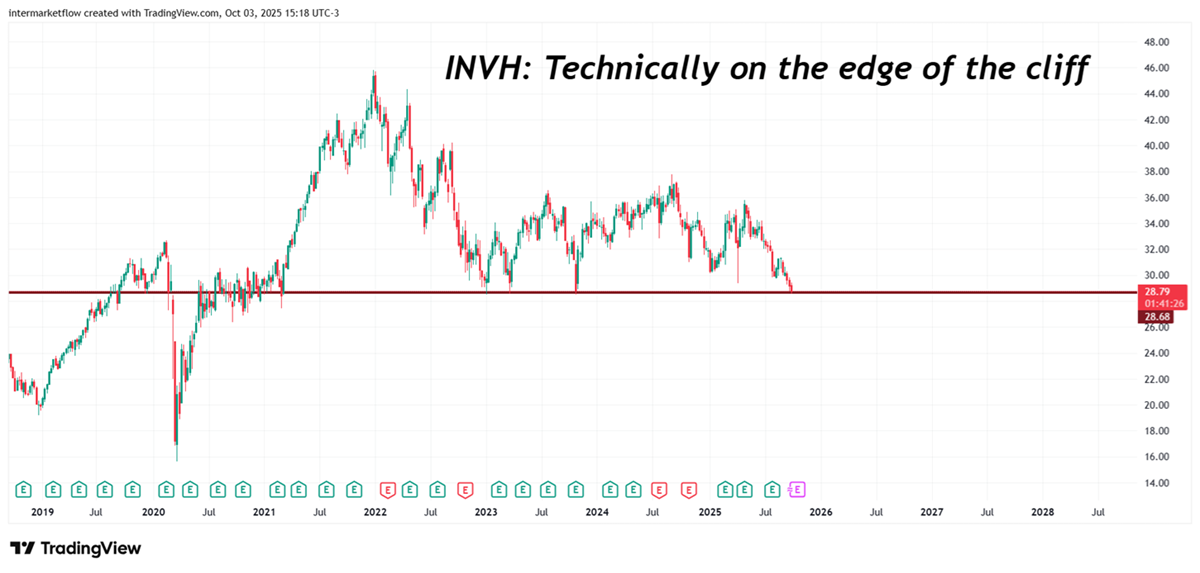
Real State Sector
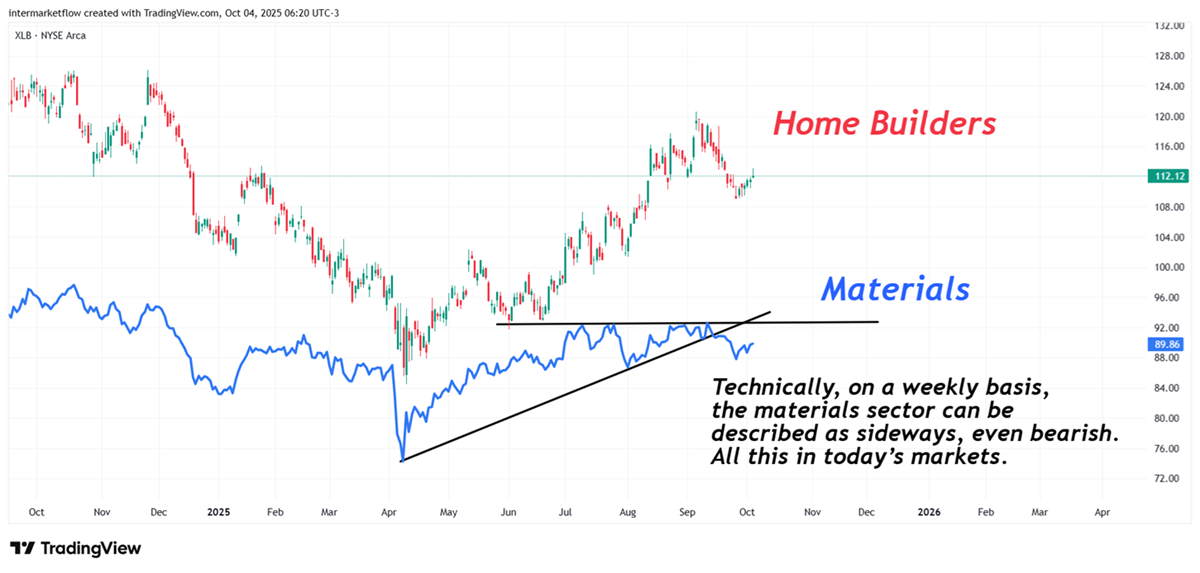
Wherever you get your information, the dominant media narrative is one of total triumphalism. Record high after record high after record high… yet when you dig deeper, you find sectors that are being left behind.
Residential Markets and Volume Losers across all sectors, actions and listed ETF in the U.S. markets on a weekly basis.
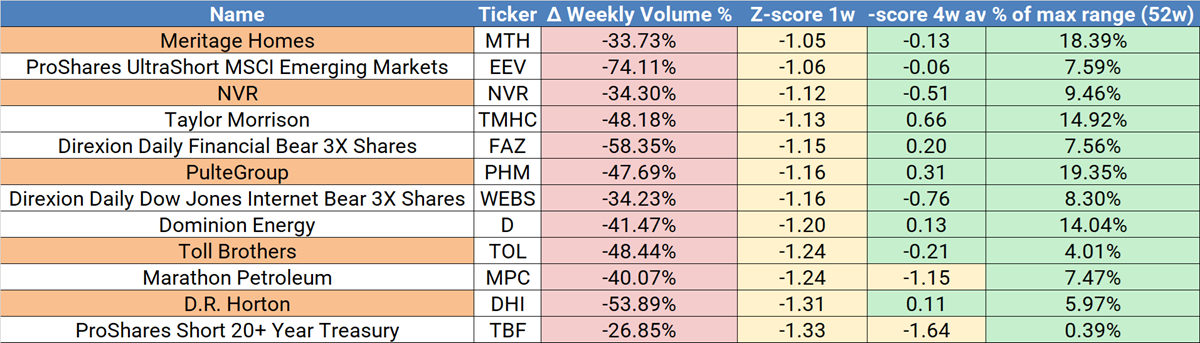
Among the 12 assets with the largest volume declines this week, 5 belong to the Home Builders sector. All the drops are significant relative to themselves, as reflected by the Z-score, and all occur in a context where weekly trading is below 20% of the max-min weekly volume range over the last 60 weeks.These are the setups we’ll be working on next week.
If you believe this is an error, please contact the administrator.
One Response