PPI, Commodities and the Dollar are closely linked, shaping several key macro variables. We examine how this interaction impacts yields, particularly the 30-year yield, and inflation expectations.
We focus on the correlation between industrial commodities and the PPI. This correlation gives us the platform for a jump into the futures market. Looking at commodity futures we can understand where inflationary pressures are building and how fast inflation expectations adapt to this new normal raising yields in the process. Especially long term yields, which as yo know, are not controlled by the F.E.D decisions
After that with statistical analysis, we track last week’s intermarket flows and compare them with the previous week to capture intermarket flows and today’s macro narrative—aiming to anticipate where flows may head next.
PPI, Commodities and the Dollar
A summary of the capital flows we detected in the previous article.
- We saw the start of a Risk-ON move, visible in flows into small caps and lower-quality bonds.
- Low volume made this move less credible, and we warned about it.
- We discovered strong capital flows into commodities, where relative volume stood well above the rest.
All of this can be checked in our precious article here.
PPI, Commodities and the Dollar
Let’s look at this week’s capital flows (September 19–25), broken down by categories and different assets types.
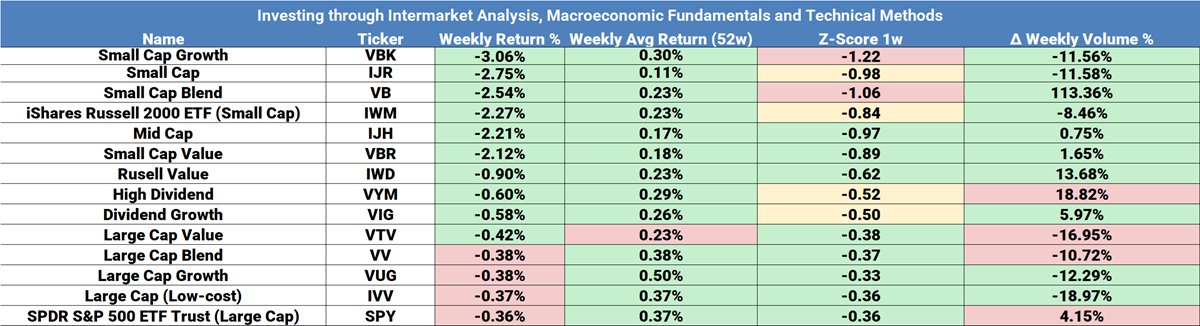
By company type.
You may recall the risk! movement expressing itself on small caps and junk bonds. Please take a look at this week’s flows, ordered from the worst return upwards. Small caps saw a reversal not only in returns but also in the inflows they had received the previous week.Looking at z scores you can quantify how extreme these outflows were. The three worst cases fell 2.75% on average. A move significant in terms of their own weekly returns. You can refresh (Z-scores) here.
Bonds
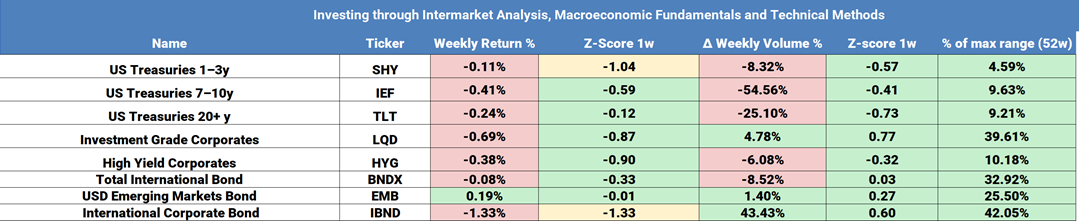
Yields climbed across the curve, driving negative returns at all segments of the curve (pushing yields up across maturities, more so on long term yields). Same thing with credit tiers. Bonds as a category have been shedding capital for three weeks now, leaving us with a higher curve that will weigh on the real economy.
Commodities
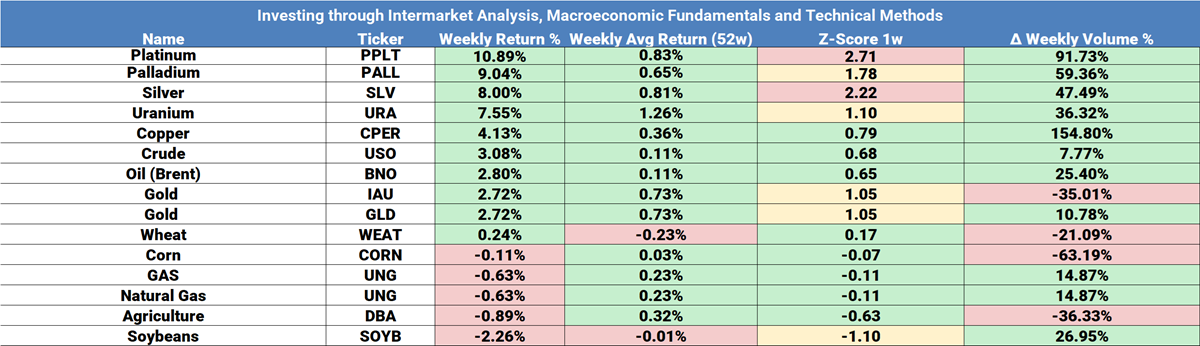
Volume had already signaled it the week before. The move was confirmed this week: Industrial commodities saw a surge in both volume and returns, as you can see in the first six rows in the table.
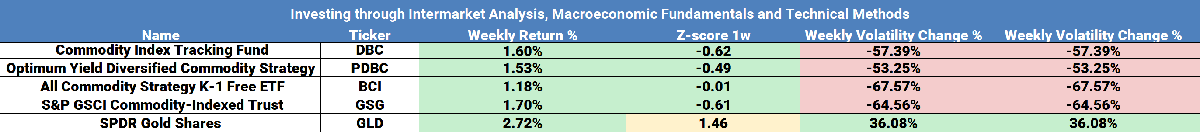
Furthermore, we grouped them together and—see the last column—volatility also drops. It’s a trending move with little resistance so far, which explains the sharp decline in volatility.
Commodity Volume
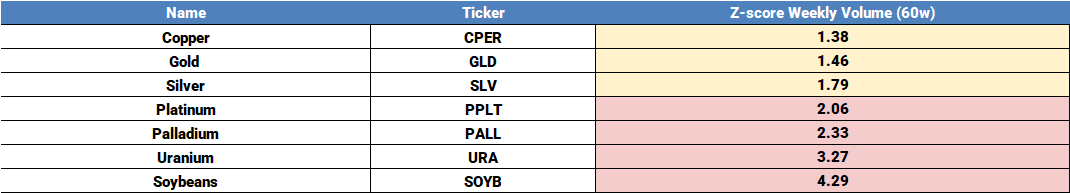
Inflows into palladium and platinum were more than two standard deviations above average—an extreme move. Silver and copper also saw strong inflows. Z-scores reveal a large, concentrated rotation into commodities, especially industrials. This is key to today’s market narrative.
PPI, Commodities and the Dollar
On Sept 23, J. Powell said:
“Inflation risks are “tilted to the upside,” while employment risks are “to the downside.” He called it “a challenging situation.”
As noted in the previous article, the Fed is at a crossroads: its two mandates demand opposing measures, and views inside the committee remain deeply divided. To make this situation worse, spreads between rates and inflation are closing up. The Fed is immersed in its own uncertainty.
PPI, Commodities and the Dollar
So, what does the market think?
In today’s environment, the table below has become daily mandatory reading. You can find it here and explore it in different formats.
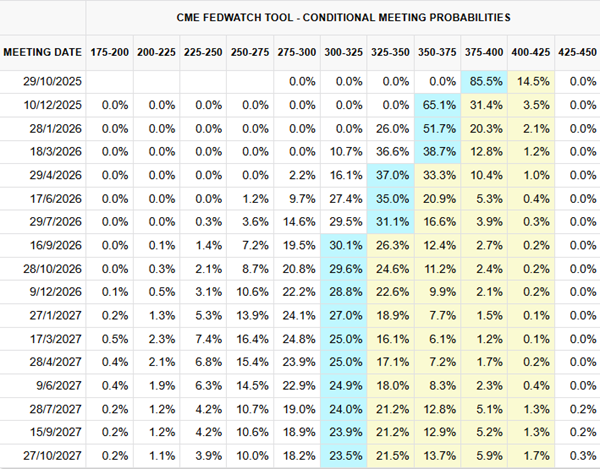
On the Y-axis are upcoming Fed meeting dates; on the X-axis, interest rate ranges. The light-blue path shows today’s market view. For Oct 29, 2025, markets price an 85.5% chance of a 25bp cut, putting the rate at 3.75 — 4%. These probabilities come from rate futures on rates, meaning they represent pure market expectations.
PPI, Inflation and Commodities
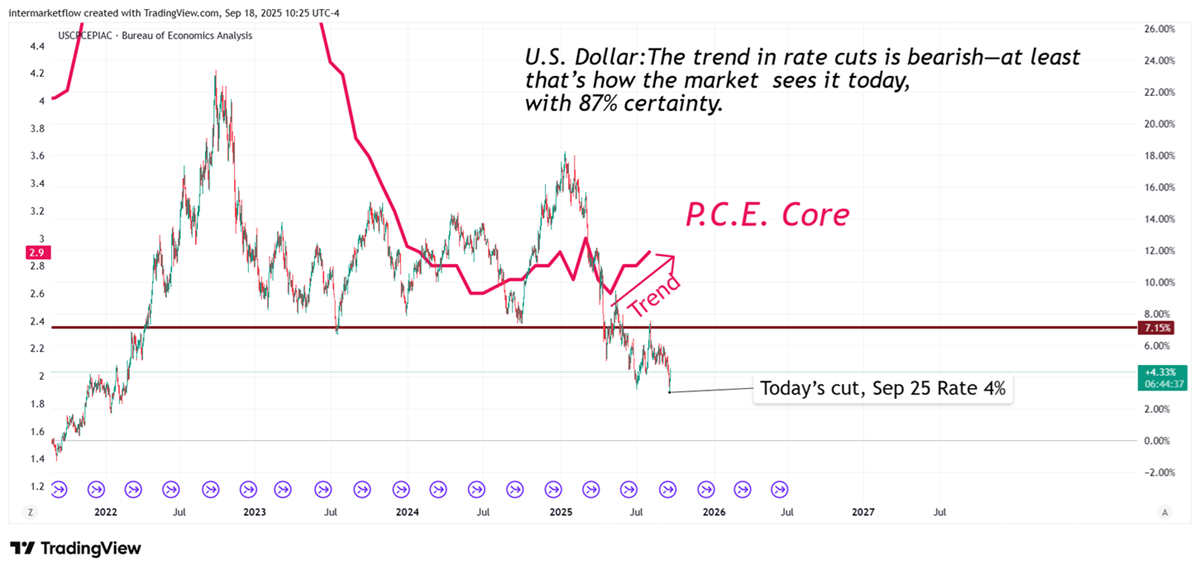
Current expectations on rate cuts point to a weaker dollar ahead, which will inevitably affect commodities. Why? Because they are produced and commercialized in dollars.
PPI, Inflation and Commodities
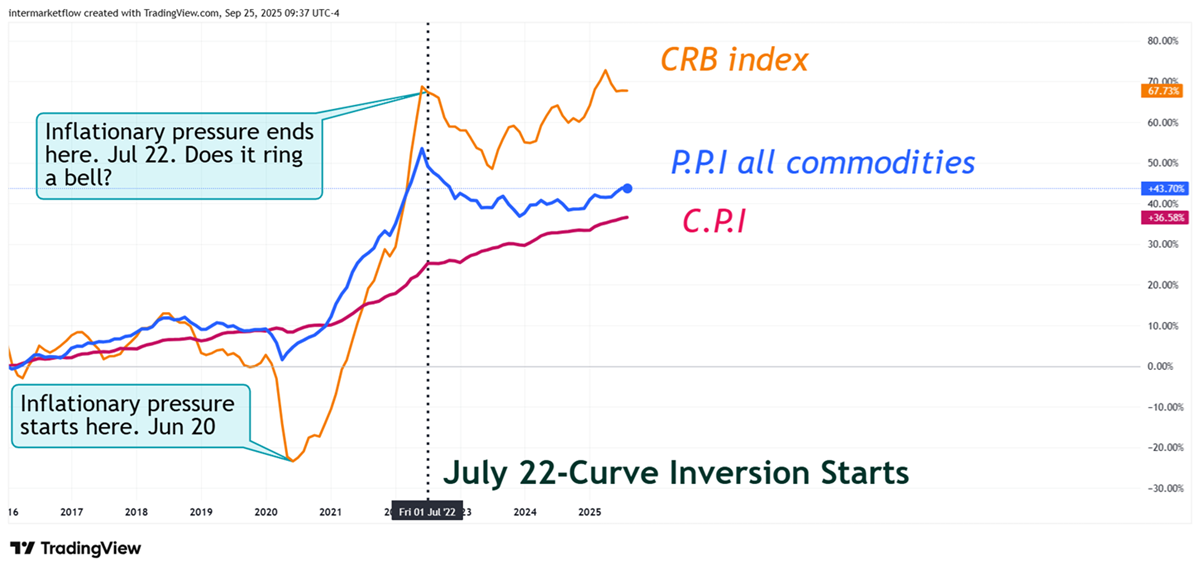
“ History doesn’t repeat, but it often rhymes”
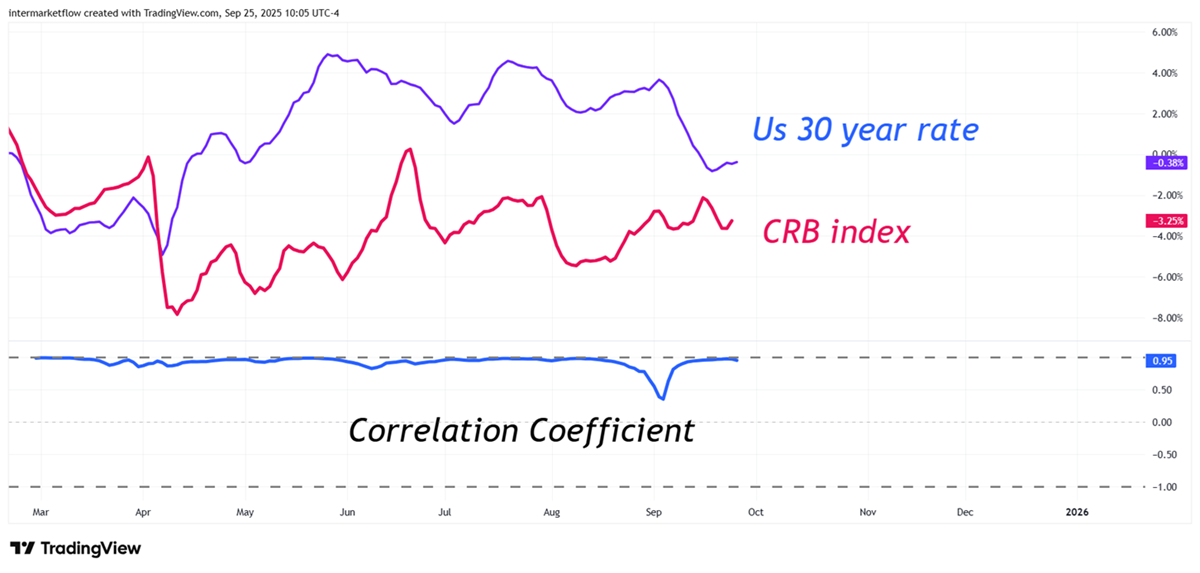
The CRB index first peaked the same month the yield curve first inverted. Expectations of weaker demand quickly drove commodity prices lower. Dollar expectations for a further devaluation inverted that trend generating new maximum and an upward trend.
Inflation is a monetary phenomenon, yet shaped by real pressures. At the start of the value chain, commodities set the tone for inflation preasures—stronger in inelastic goods like oil, weaker in agriculture goods clearly more elastic. Their pass-through effect depends on the current macro cycle, dollar outlook, company margins, and consumer strength among others
PPI and Industrial Metals Correlation
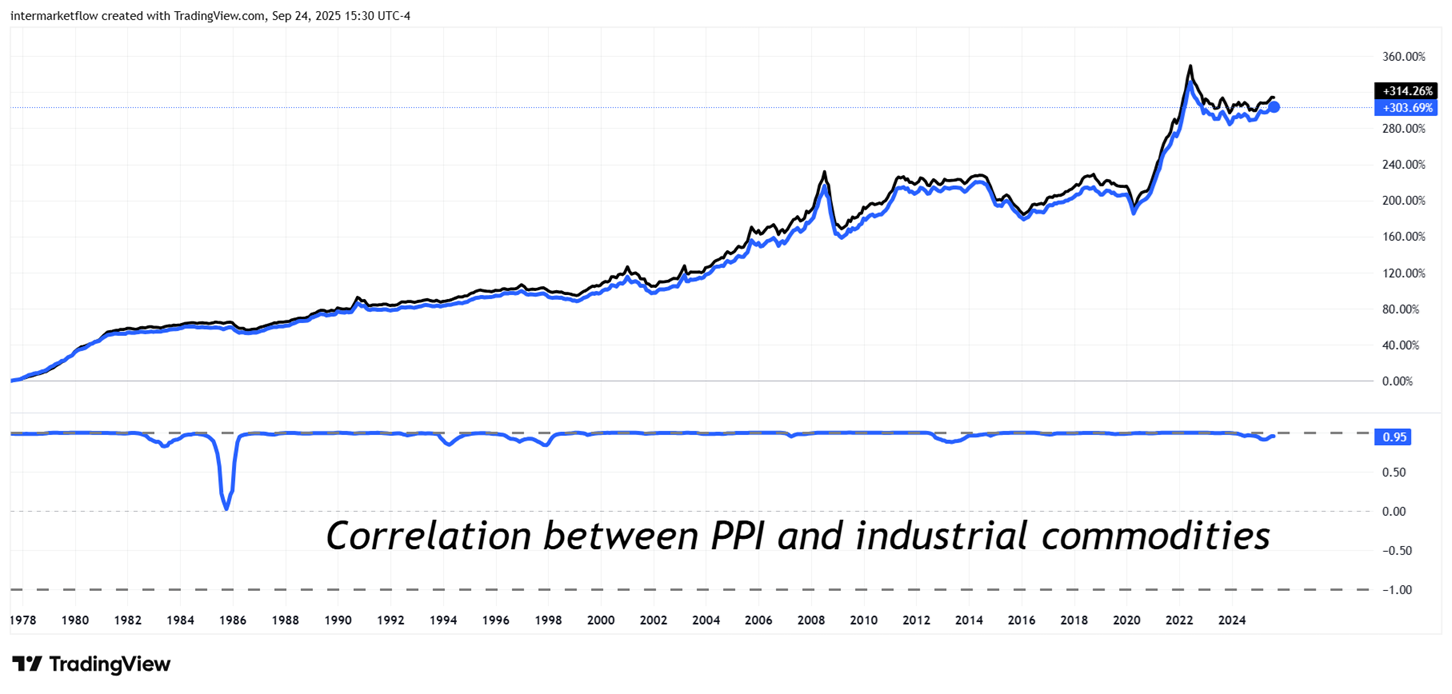
It’s the first causality in intermarket analysis. Below is the correlation between PPI and industrial commodity prices.
PPI, Inflation and Commodities
This correlation gives us a platform to move into futures. Commodities trade in futures markets, so we can look at the front-month November contract prices the markets expect. (By the way, last business day of October, aligned with the next FOMC meeting).
PPI, Inflation and Commodities in Futures
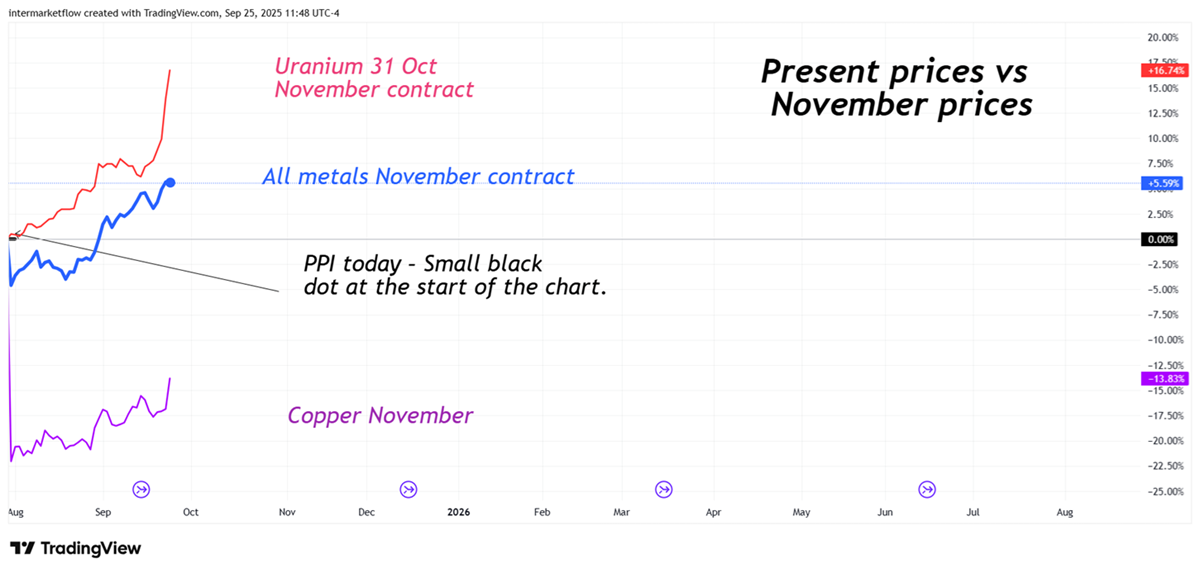
The reason we present the chart this way is to highlight the evolution of metals against today’s PPI level—the black dot on the left axis.
Our focus is on the prices the market expects for November 2025. As noted above, the correlation between these metals and the PPI is nearly perfect over time.
With highly inelastic commodities like oil and copper, inflationary pressure originates. Futures show markets and expect them to rise across the board. Why? Commodities prices are the symptom. Dollar value expectation is the disease. Remember, cuts are coming even more so.
PPI, Inflation and Commodities: Inflationary Pressure
When we break down the 30-year yield into its components—real rates, inflation expectations, and term premium—we can analyze each variable separately.
PPI, Inflation and Commodities
Another way to think about long-term inflation expectations is through long-term commodity prices then. It’s key to remember that 30-year inflation expectations are set today—right now.
PPI, Inflation and Commodities: Inflationary Pressure and the Dollar
The Context
Let’s think together the sequence:
- Markets see a clear path for rate cuts over the coming months.
- This shapes expectations for the dollar: ceteris paribus, a weaker dollar ahead. From a technical point of view, charts confirm the drop—breaking key support with downside potential.
- Expectations of a weaker dollar lifts commodity prices. Commodities are produced and traded globally in dollars, with input costs largely dollarized. Since they are capital-intensive, not labor-intensive, dollar depreciation flows directly through the production chain—raising prices, via pass-through of higher production costs.
All of this is now showing up in markets
To wrap up
- Expectations for a weaker dollar ahead is a direct hit on inflation expectations (induced by higher commodity prices).
- This situation triggers the much-feared unanchoring of long-term rates.
- This fear is well-founded. The 10- and 30-year rates are decisive for real economic growth and out of FED control.
- As we said, all this loop is based on future expectations for dollar weakness
- With rate cuts coming, expectations for the dollar are not good, reinforcing this vicious circle.
Trading conclusions
In recent weeks, moves have been extreme. A pullback to the mean is to be expected in commodities. It’s time to apply the following trend systems and buy the dip on them.
See you next Sunday, God willing.
If you believe this is an error, please contact the administrator.