The connection between the Labor market and Consumption, and how the role of the state intervenes in this economic cycle, altering causalities.
We’re going to flip the order of the analysis. Since the market seems disconnected from reality, we’ll start with prices, then move to weekly stats and technicals, and finish with the macro argument.
Tracking Capital Flows: Weekly Trading
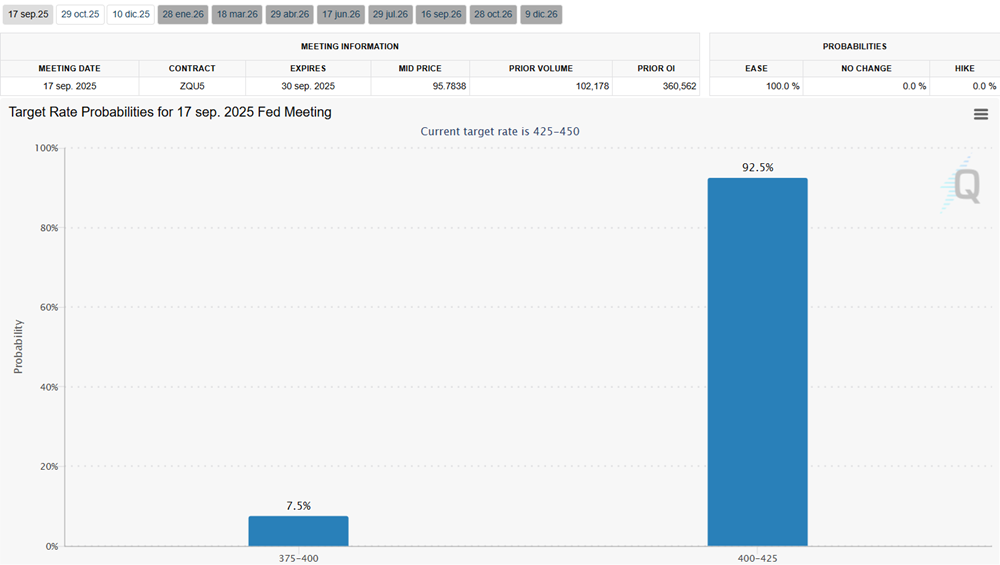
The market has traded all week with certainty about the rate cut on Wednesday, the 17th. This week’s move already priced it in. A setup for the classic “buy the rumor, sell the news.”
Tracking capital globally
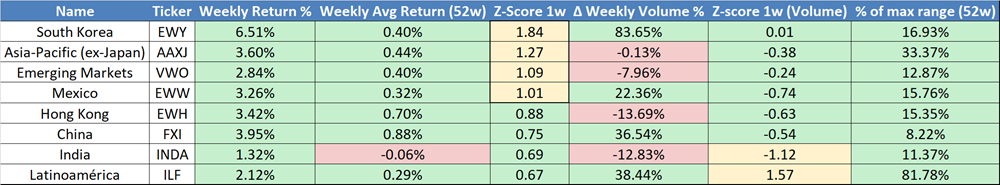
With that certainty, capital flows went exactly where they had to. A truly global perspective. The weekly return winners from a geographical perspective.
Capital moved into emerging markets. The Fed’s rate cut helps them. South Korea stands out: Remember, we flagged it here: a Z-score of 1.84 means this weekly return is 1.84 standard deviations above its mean weekly return. That’s an extreme weekly move.
Tracking Capital: Categories within the SPY
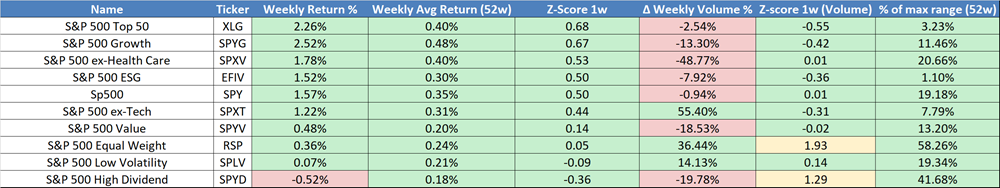
There’s a broad move higher, but here’s the problem: almost every group is trading on lower volume, except for the low-volatility ones. The equal weight is kind of catching up in a thin market
Tracking Capital: U.S. by Sectors
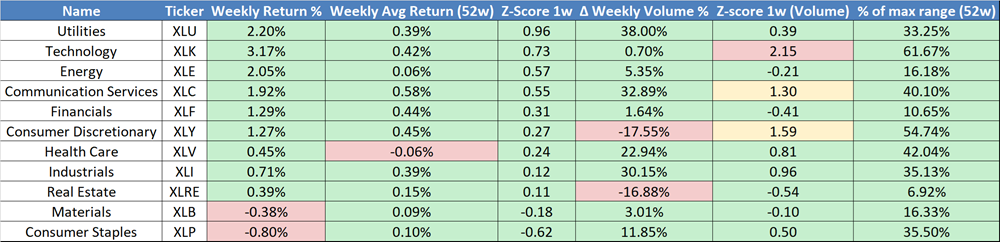
All categories are up, but two stand out on falling volume: Discretionary and Real Estate—both cyclical sectors.Furthermore, the exit from the discretionary sector was pretty extreme (z of 1.59 with a volume equal to 54.74% of the weekly range, for this sector). In a thin market this proportion is big!
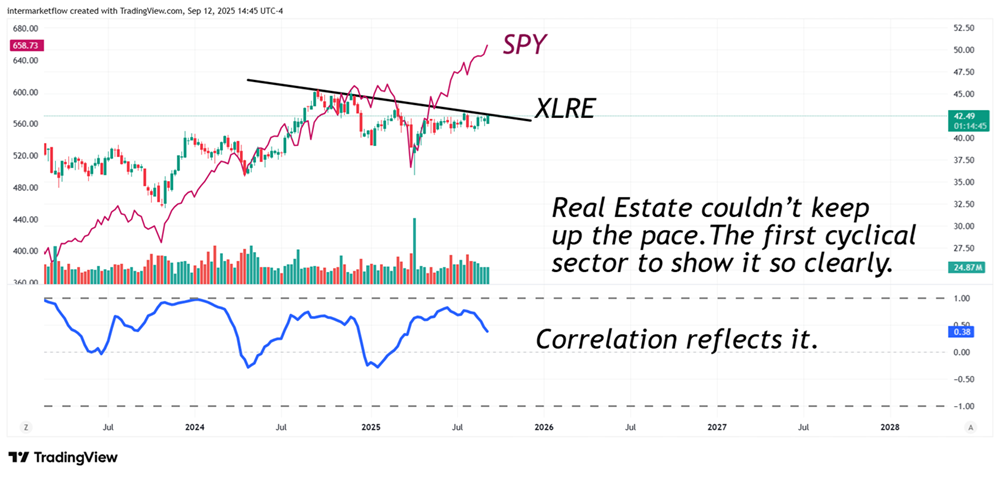
Tracking Capital: Real State
The Real Estate sector is a leading sector. It can no longer keep pace with the S&P 500. The correlation has broken. The gap between reality and the markets has become too wide.
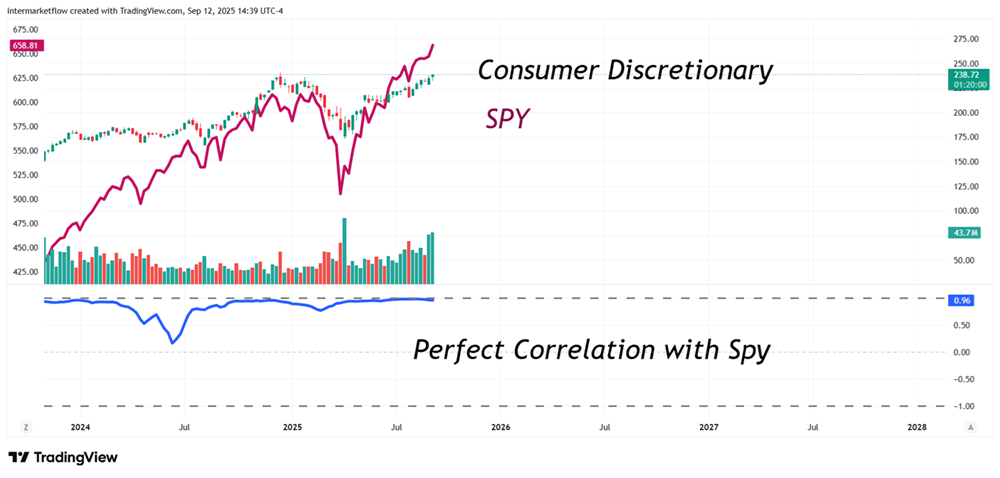
Tracking Capital: Consumer Discretionary
The state of the correlation is perfect. Everyone is aligned.
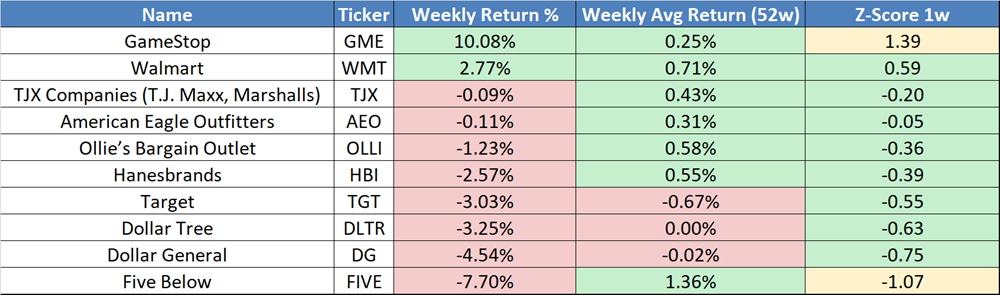
Tracking Capital: Going Deeper
Is the market validating the real economy—or not? If we look at consumer discretionary companies it seems so.
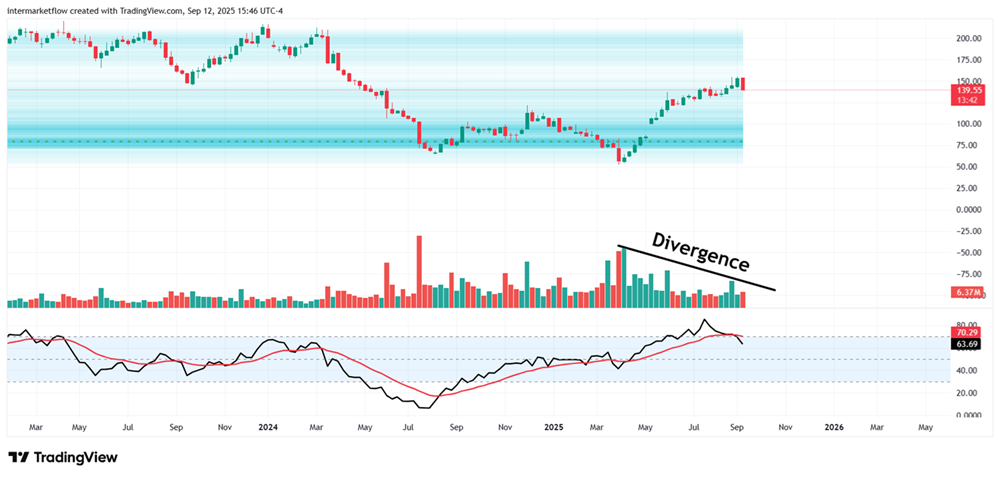
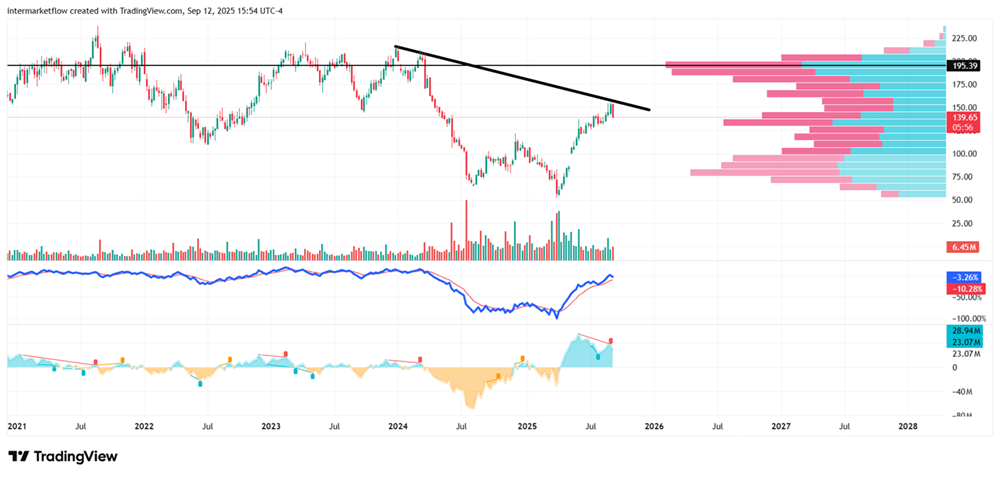
Tracking Capital Vehicle: Five Below (FIVE)
We’ve got a sector set for a correction: a bearish divergence, overbought in a low-value area. Weak intensity in light blue—another way to read the volume profile.
From a technical perspective, it’s a perfect setup.
On-balance tells us this is a crowded trade. The weekly candle breaks market structure.
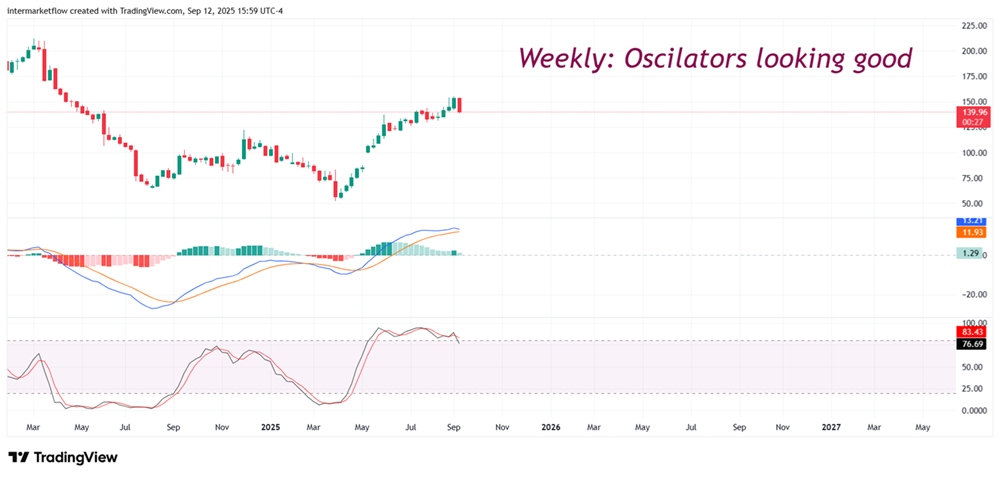
Oscillators in position. On a weekly timeframe, the price has a perfect setup.
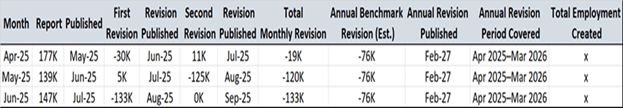
In March 2025 we published this article. In it, we highlighted the weaknesses in Nonfarm Payrolls: its data collection methodology, the technology used to process it, and the subjectivity it lends itself to, recommending others reports for analysing the labor market. As a summary, I’m leaving this table here, but it’s a topic that deserves a deeper analysis.
Labor Market and Consumption
This is job creation since April 25 .When we incorporate the first and second monthly revisions and the annual revision.
Labor Market and Consumption: Non Farm Payroll
Two monthly revisions.
One annual revision: the study period always runs April–March.
Example: February 2025 used the period March 2025-April 24 for the revision. This creates a lag of 11–22 months, averaging 17. Sounds like a joke or a mistake. It’s not.
That’s why in March 2025, in this article we recommended these indicators to analyze the labor market for different reasons:
Initial, Continuing Claims.
ADP report
Job Postings on Indeed for the U.S.
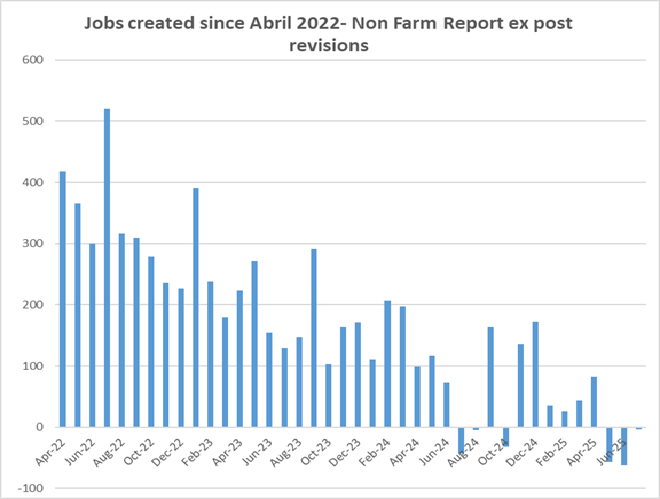
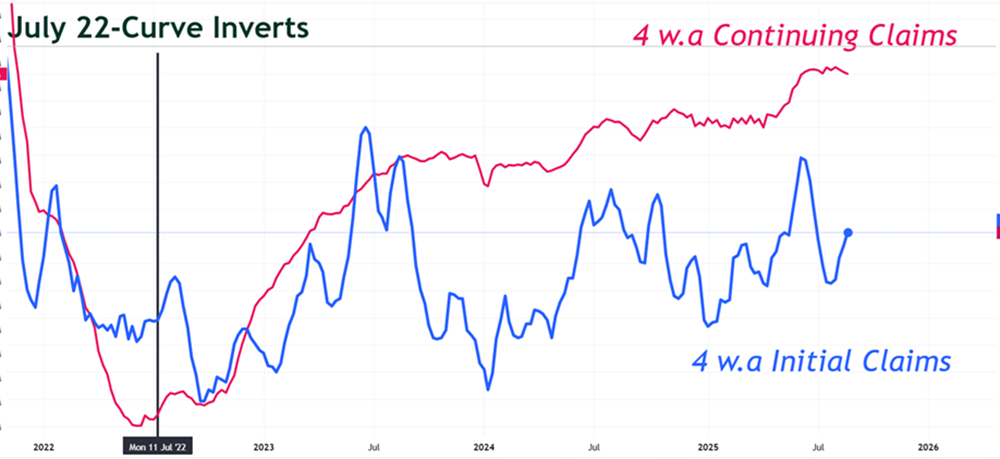
Labor market and consumption: Nonfarm ex-post revisions.
It’s no coincidence that the chart begins in April 2022. In July 2022 the yield curve inverted, and this is what happened with the labor market.
Inflection point: July 22. The economy started failing to resolve unemployment claims. This is where the state steps in.
Labor Market and Consumption: The imbalance, causality, and government intervention.
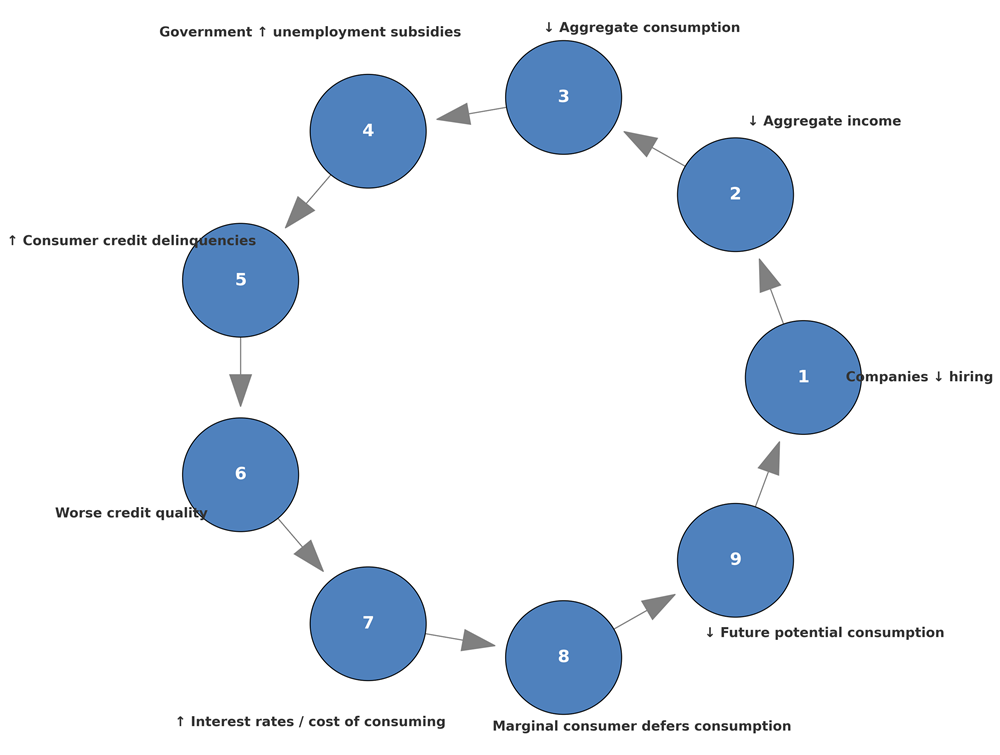
Labor Market and Consumption: Causalities and the role of the state
Less work is created, Aggregate Income starts to fall, and with it, aggregate consumption in nominal terms. We are not taking inflation into account yet.
The government intervenes in this partial imbalance: unemployment insurance kicks in. Jobs solutions have become increasingly difficult to resolve since July 22, as companies create fewer and fewer jobs.
This generates growing subsidies for two reasons: • Solutions are delayed over time or simply never appear. • More and more people enter this group (Initial Claims).
Of course, nominal aggregate income falls, there are fewer job opportunities, but with one aggravating factor: inflation. Therefore, in real terms—which is what really matters—real disposable income falls much more.
People are reluctant to change their lifestyle. We all are. Thinking it’s a transitory shock, consumption remains at the same levels through consumer credit.
Delinquencies start, as incomes keep falling and inflation remains steady.
Over time, delinquencies turn into losses (not yet reflected in bank balance sheets. (Opportunity!)
Seeing that the risk-return situation changes, banks raise rates, which triggers two effects: • It defers present consumption. • It defers near future consumption.
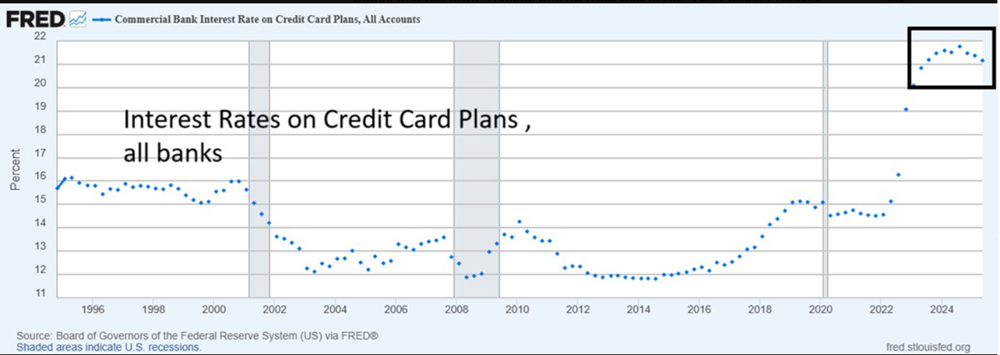
Credit rates: Levels not seen at least since 1996. Way higher than dot.com and G.F.C recessions (between 21% and 22%).
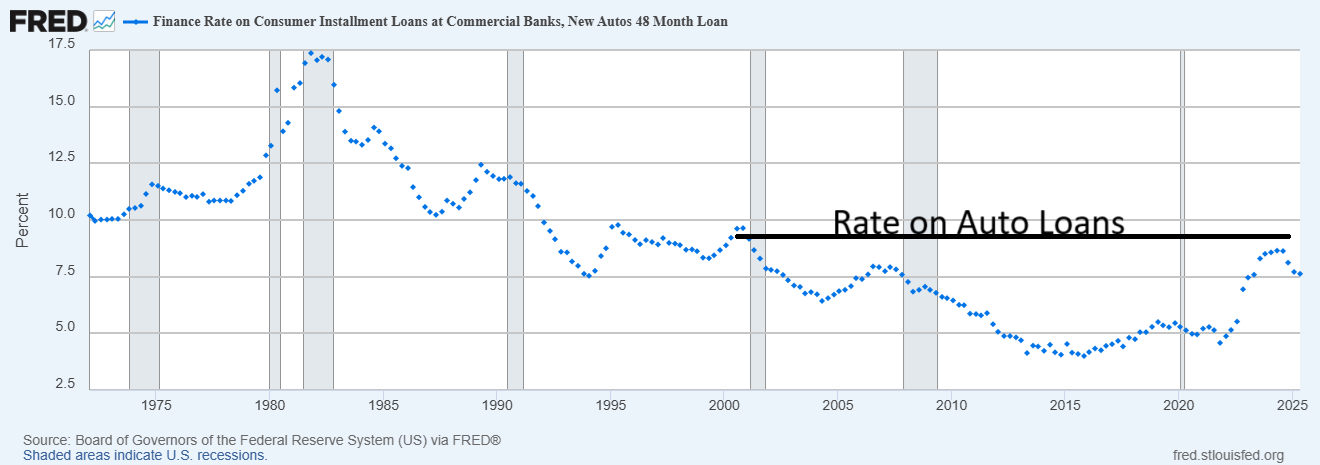
Rate on Auto loans in levels similar to the dot.com and greater than at G.F.C. recession
Of course, both factors impact companies, and the vicious cycle starts all over again.
The first companies that will feel it are those that depend on the first consumers who are feeling it.
That’s all for this week.
Remember, these are not trading recommendations. This summarizes our weekly work, which we share for marketing purposes.