
The Glass Market: High Prices, Hollow Liquidity and Extreme Fragility
The Core Denominator
- Apathetic markets marked by persistent capital withdrawal.
- Zero meaningful rotation across or within asset categories.
- A definitive Hands-Out environment where cash and short-term debt remain the ultimate safe havens.
Volatility Regime and the Yield Curve
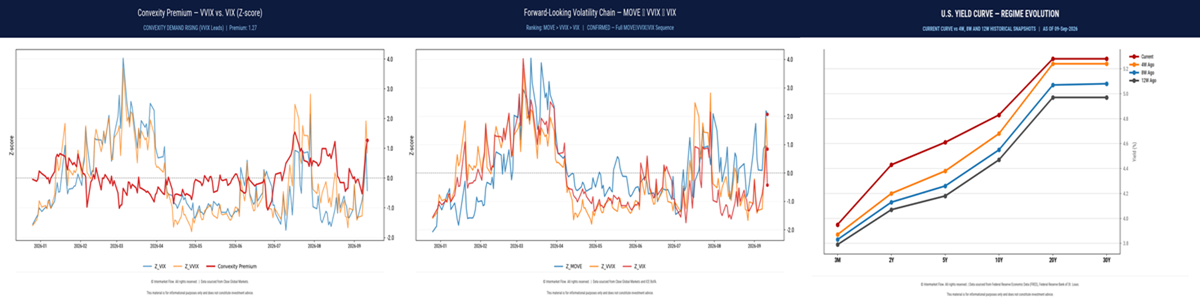
- The entire yield curve has shifted higher over the past 12 weeks, locking in a permanent increase in the cost of capital.
- MOVE leads the volatility chain.
- VVIX is outpacing VIX, with the convexity premium hitting +1.27σ, signaling aggressive demand for downside protection.
- VIX remains the laggard: rates have repriced and convexity demand is surging, but equities refuse to price the risk.
Intermarket Regime
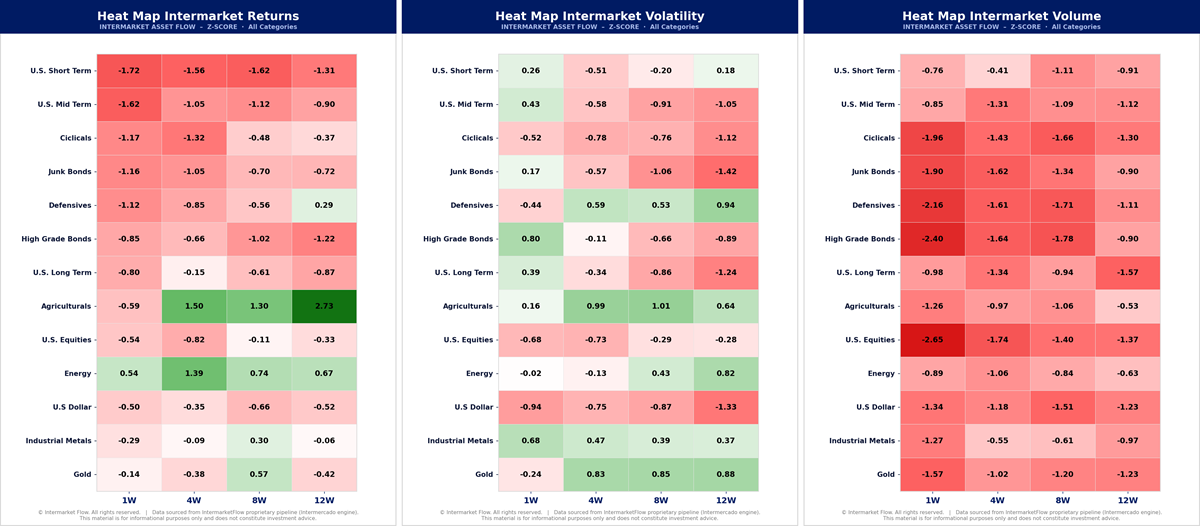
- Participation is below average across every single category and time horizon.
- U.S. equity volume has collapsed from −1.37σ at 12W to −2.65σ at 1W—the most violent contraction in the intermarket structure.
- Market depth is gone. Prices are hyper-sensitive to marginal flows and primed to overshoot violently on any real distribution.
Tracking Capital: A Global Perspective
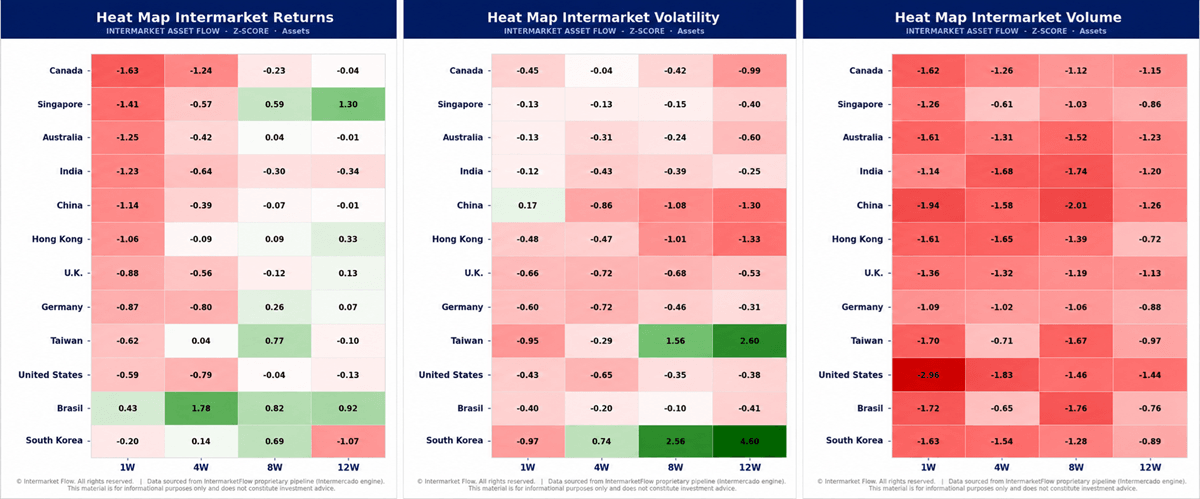
How to Read Each cell displays the Z-score of returns, volatility, or volume relative to each country’s own history across 1W, 4W, 8W, and 12W.
- Returns weakened broadly over the last week; Brazil stands as the sole positive outlier.
- Volatility remains suppressed, showing no generalized panic—yet.
- Volume is contracting globally, anchored by the United States at −2.96σ in a profoundly thin weekly print.
Magnitude of Relative Capital Flows Across Countries
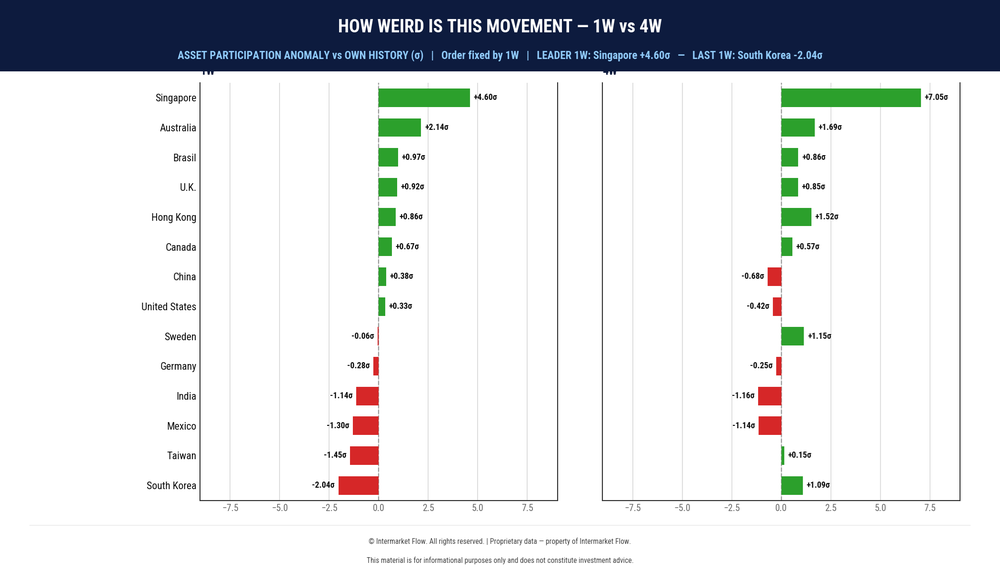
How to Read: Each bar shows the Z-score of the change in a country’s share of total global volume, measuring relative movement across 1W and 4W—not absolute inflows.
- Singapore claims the largest relative share expansion.
- Australia, Brazil, the U.K., and Hong Kong also picked up relative participation over 1W.
- Reality check: Singapore’s absolute volume is still falling. Its share is rising solely because participation is bleeding out faster everywhere else.
- Global liquidity is not recovering; Singapore is merely the last dry spot in a shrinking pool.
Market Drivers
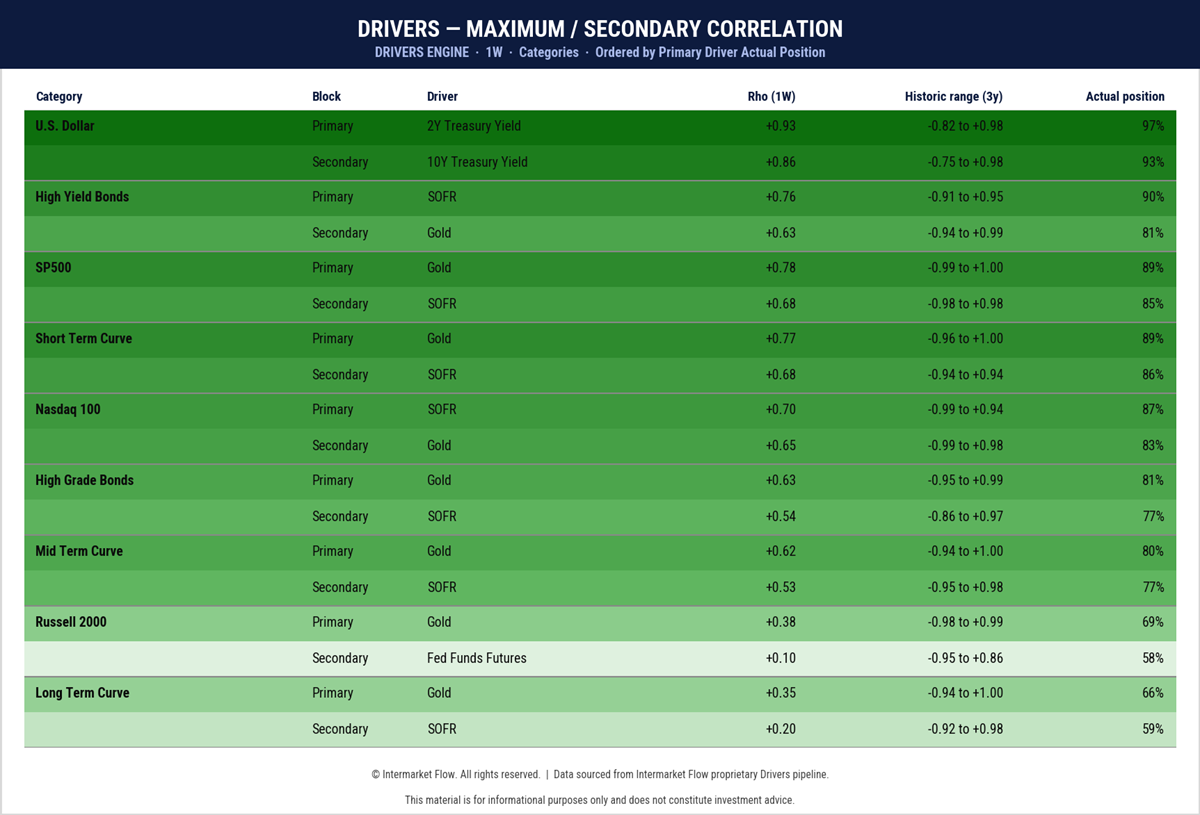
How to Read
Rho measures the direction and strength of the 1W correlation between each category and its selected driver. Values near +1.00 indicate that they tend to move together; values near −1.00 indicate an inverse relationship. Actual Position shows where the current correlation stands within its three-year historical range.
- The U.S. dollar is strongly linked to Treasury yields: +0.93 with the 2Y yield and +0.86 with the 10Y yield. Both relationships are near their three-year upper extremes.
- High Yield–SOFR (+0.76), S&P 500–Gold (+0.78) and Nasdaq–SOFR (+0.70) are among the strongest relationships.
- The market is no longer focused only on what the Fed may do.
- It is beginning to measure how much pressure current rates can transmit through funding costs, asset prices and market structure.
- This is a warning signal, but one week is not enough time to confirm liquidity stress.
Equities
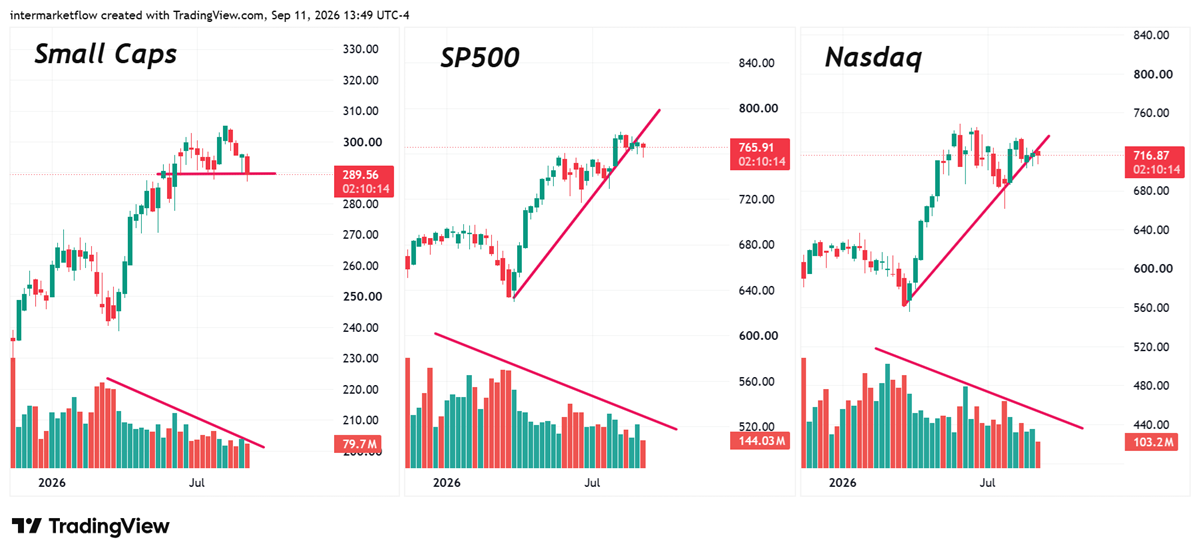
- Small Caps lead the breakdown: Broken uptrends, testing the 289–290 support zone, and structurally exposed to high financing costs.
- The S&P 500 and Nasdaq cling to rising price structures, but they are climbing on flatlining volume.
- Prices stay elevated while actual market participation vanishes.
- The current structure is dangerously dependent on large-cap concentration and vulnerable to a sharp reversion.
A technical analysis note
- Divergences are among the most effective technical signals. They do not determine whether prices will continue rising or falling.
- Instead, if the divergence remains unresolved, price eventually adjusts because of insufficient buying or selling pressure, depending on the type of divergence.
- If the divergence persists, the question is no longer whether the adjustment will occur, but when.
- The logic is mathematical: a sustained divergence progressively exhausts the available buyers or sellers, pushing the price structure toward maximum fragility.
- In such a thin market, even routine profit-taking can trigger an outsized move, which then feeds additional selling until dip buyers absorb the pressure.
- Each rebound consumes part of that remaining demand—until there are no dip buyers left.
Recap
- The evidence has moved past early warnings into an advanced risk phase.
- Cost of capital: The 12-week shift higher in the yield curve is structural, not transient.
- The entire yield curve has shifted higher across all maturities, forcing a repricing across asset classes.
- No duration segment is immune, although the magnitude of the impact varies with duration exposure.
- Volatility sequence: MOVE leads VVIX, and VVIX leads VIX. The +1.27σ convexity premium proves protection is being bought ahead of equity repricing.
- Funding pressure: SOFR is directly dictating asset behavior across credit and equities. This is not a common occurrence. When it happens, it signals that the market’s focus is shifting toward risks emerging in the real economy.
- Participation collapse: U.S. equity volume at −2.65σ and geographic participation at −2.96σ confirm a hollow market.
- A market without depth is, by definition, a market of extreme fragility. The first consequence is that price movements become larger than they would be in a deep market. Prices simply fall through a liquidity vacuum, without enough market structure to absorb the move.
- Fragile leadership: Small caps have cracked while major indices float on missing depth.
- This greater fragility also identifies the vehicle for an eventual short position—if it has not already created the opportunity.
Course of Action
- Passive caution is obsolete.
- Zero beta exposure.
- Zero duration.
- Hoard liquidity.
- Buy defined-risk convexity before the equity index completes its adjustment.
- Volatility mean reversion is the current available opportunity.
When to attack?
- A weekly volume spike qualifies as confirmation only when it is statistically abnormal. In this framework, the threshold is +1.5σ or higher, which filters out ordinary fluctuations and market noise.
- Readings between −0.5σ and +0.5σ are considered normal and do not provide sufficient confirmation.
The market has already delivered its verdict. The only question is whether your capital is still exposed to the vacuum.
For the Professional / Institutional Reader
The divergence between bonds and equities is not a theory; it’s a countdown. Relying on delayed retail reports means trading blind. Access the raw capital flows, depth Z-scores, and execution setups before the volume breaches the 1.5\sigma threshold.
Join the Desk
Intermarket Flow
If you believe this is an error, please contact the administrator.