
Where the Next Liquidity Break Is Most Likely to Appear
Nothing has broken in price yet. The internal structure is already deteriorating.
Three signals define the current regime:
- Russell 2000 remains the weakest equity structure.
- U.S. 20Y+ carries the greatest duration risk.
- VVIX continues to price a volatility shock that VIX has not confirmed.
The common denominator is not panic. It is the progressive disappearance of market depth—a deterioration that makes the market thinner, more exposed, and more dangerous with each passing day.
Risk-On: Equities
S&P 500
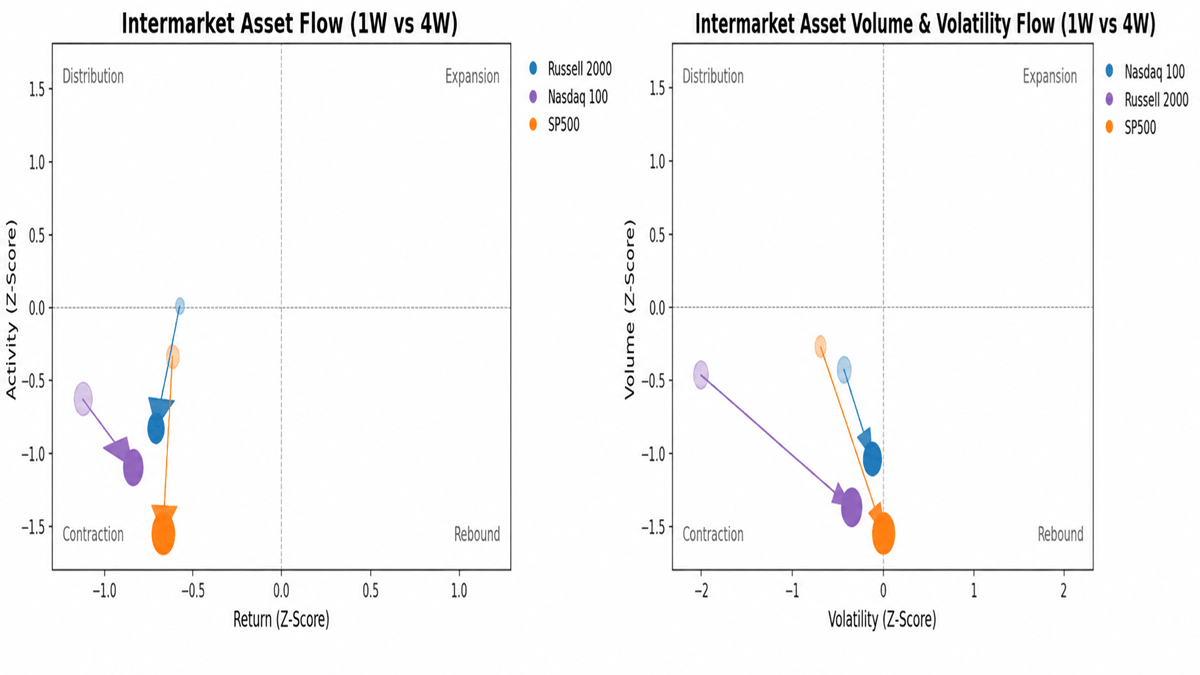
- Return: −0.6σ | Activity: −1.5σ | Volume: −1.5σ | Volatility: ~0σ
- The index is weakening while both Activity and Volume remain deeply negative. The absence of volatility does not confirm stability; it shows that price deterioration is developing without broad participation. A modest macro shock could therefore produce a larger-than-normal move.
Nasdaq 100
- Return: −0.6σ | Activity: −0.8σ | Volume: −1.0σ | Volatility: −0.4σ.
- Technology leadership is losing structural support. Price has not collapsed, but institutional participation continues to fade, weakening the momentum profile that previously sustained the index.
Russell 2000
- Return: −1.1σ | Activity: −0.6σ | Volume: −1.4σ | Volatility: −2.0σ.
- Russell is the clearest equity expression of fragility.
- Small caps combine the weakest return profile with one of the thinnest liquidity cushions. Extremely compressed volatility does not reduce the threat.
- It means the asset is deteriorating inside an inactive market with limited capacity to absorb forced selling.
Intermarket Heatmap: Systemic Confirmation
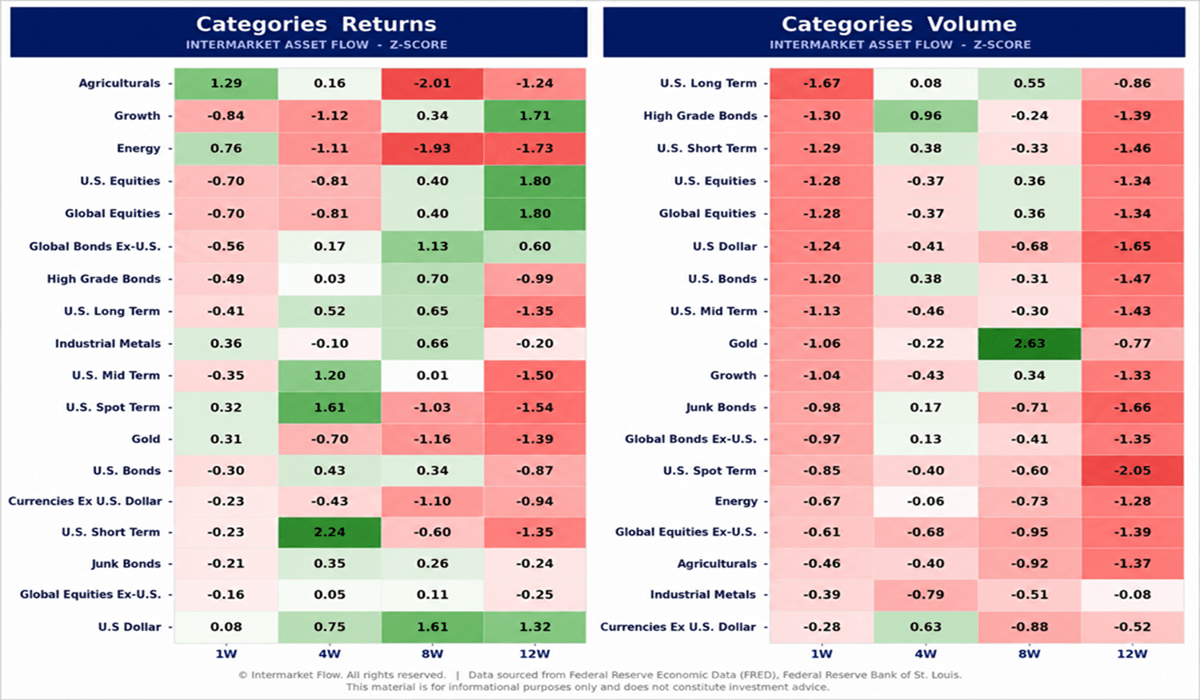
- The heatmaps confirm that the liquidity contraction is broad rather than isolated. Negative Volume Z-Scores dominate the 1W window across equities, Treasuries, credit, gold, and the dollar.
That creates two important conclusions
- First, weak returns are not yet accompanied by capitulation.
- Second, positive returns are not being validated by genuine accumulation.
- Capital is not rotating cleanly between risk-on and risk-off assets. It is withdrawing from both.
This is why aggressive dip-buying remains structurally weak. The market is not offering confirmation—only price movement inside a broad volume vacuum.
Treasury Curve: Price Without Sponsorship
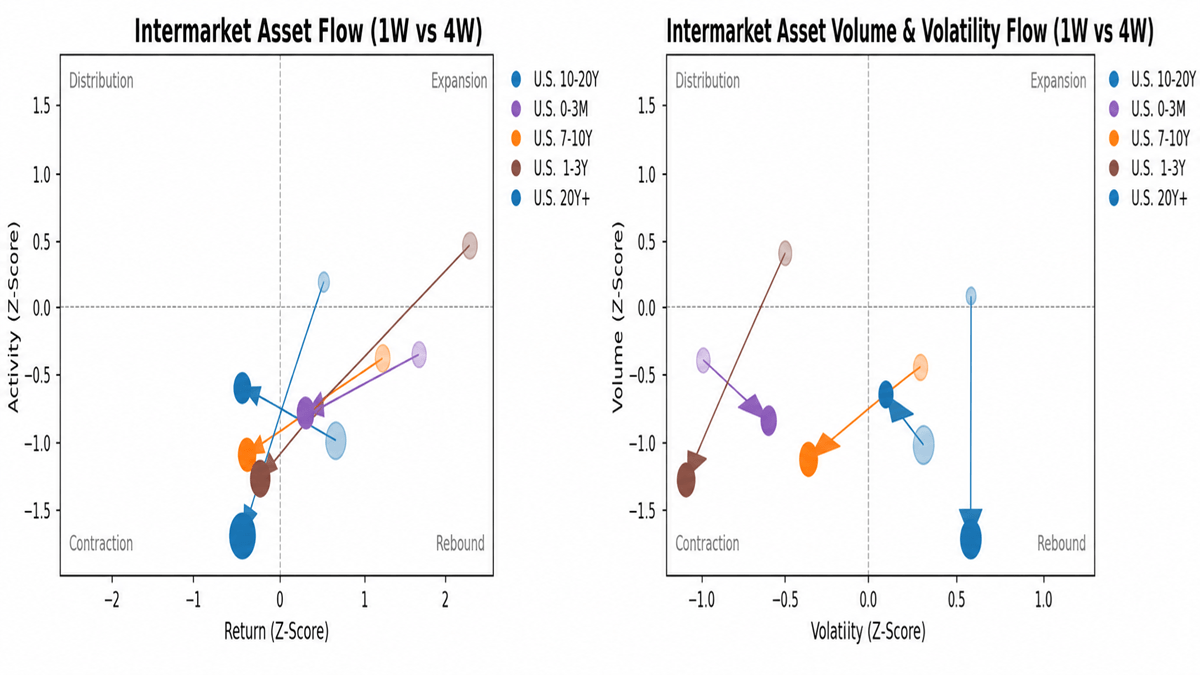
- U.S. 20Y+ is the most fragile segment of the curve.
- Return: −0.4σ | Activity: −1.7σ | Volume: −1.7σ | Volatility: +0.6σ
- Long duration is losing buyers precisely as volatility rises. That leaves the long end exposed to sharp repricing from Treasury supply, inflation surprises, or a renewed rate shock.
Mid Term
- The belly of the curve appears stronger in price, but not in structure. Positive returns in U.S. 10–20Y and 7–10Y continue to rest on weak Activity and Volume.
- At the front end, strength in 0–3M looks more like capital parking than aggressive institutional accumulation.
Volatility and Convexity
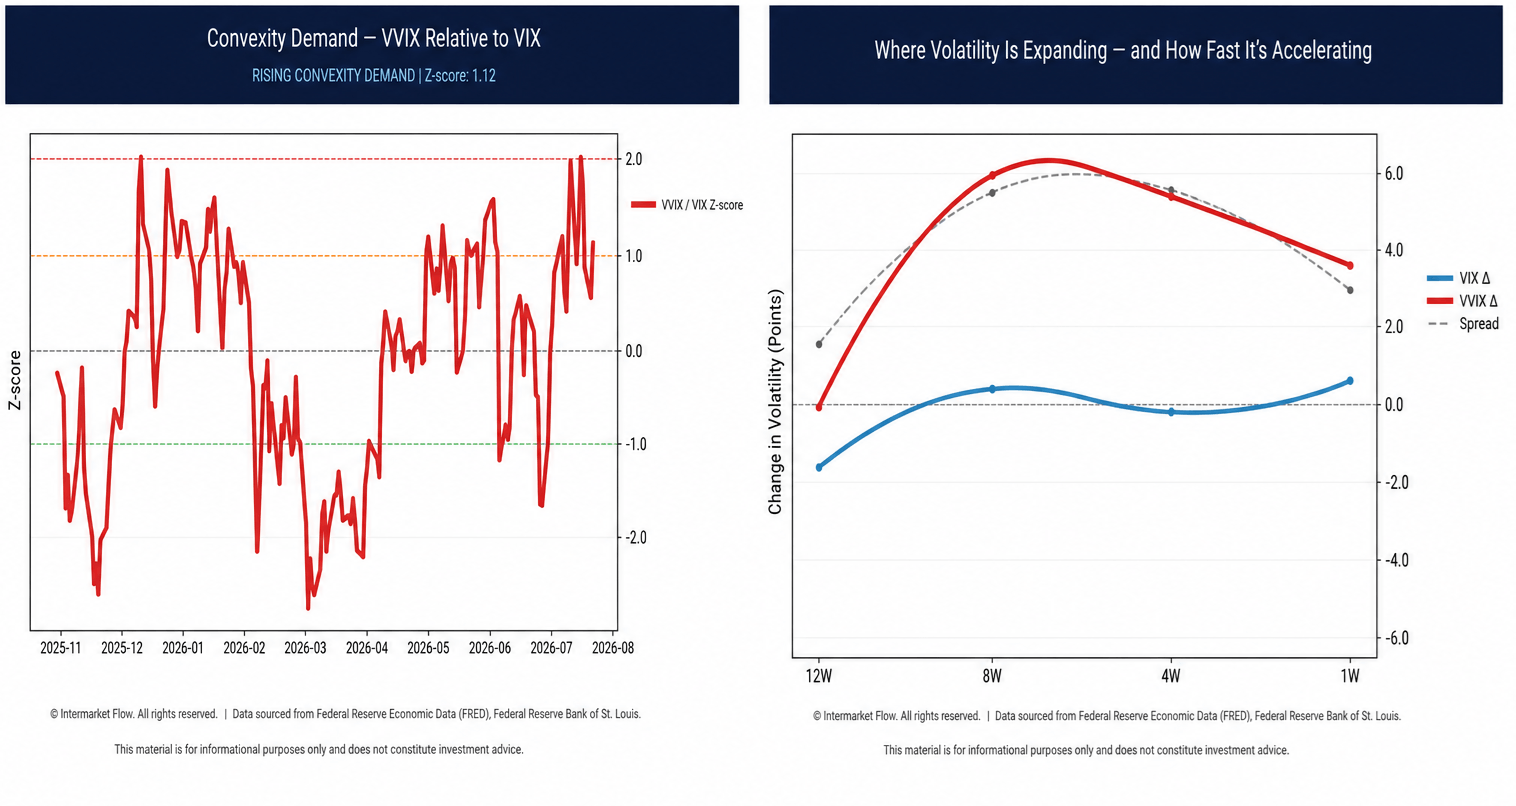
- The VVIX/VIX ratio remains elevated at +1.12σ, while VVIX continues to outpace VIX across the 12W–1W windows.
- Spot panic is absent. Convexity demand is not.
- The market is already paying for volatility acceleration before headline VIX confirms the threat.
- That divergence suggests institutional preparation for tail risk beneath an apparently controlled surface.
What Changes the Regime
The next valid signal will come from one of two developments:
- Volume and Activity recover enough to validate price.
- VIX catches up with the convexity already embedded in VVIX.
Until one of those conditions appears, the defensive posture remains justified.
Conclusions
- The regime is unchanged from last week: weak participation, poor depth, and no clean capital rotation. The difference is that each passing week further reduces the market’s ability to absorb risk.
- Nothing has exploded yet. But with sponsorship contracting and convexity demand elevated, the stage is set for moves larger than usual—even without a major catalyst.
That transition—not the next headline—is what we will track in the next report.
Intermarket Flow
If you believe this is an error, please contact the administrator.