
A dry sea
To read these Bubble Charts, follow the arrow from the light point, 12W, to the dark point 1W. The path shows how each asset, key variables (Returns, Volume, Volatility and Dollar Value) flow across time windows. The signal is not a single dot; it is the sequence.
All variables are expressed as Z-scores against each asset’s own historical behavior. This allows us to compare return, activity, volume and volatility for each time window, across the intermarket structure on a standardized basis.
Credit Risk
Investment Grade and High Yield have migrated back into the contraction quadrant.
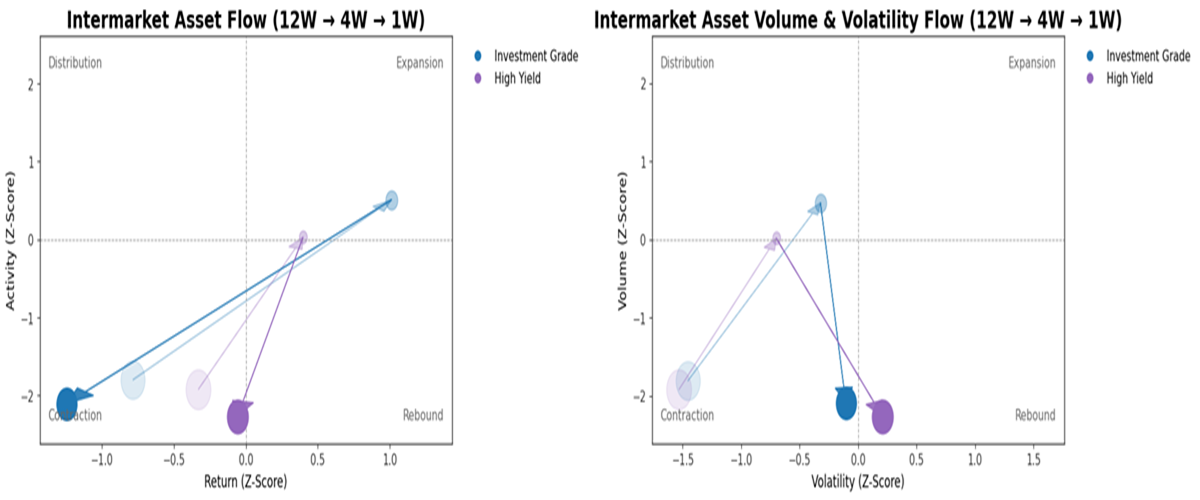
- The previous improvement in credit did not hold. Both assets now show weak activity and collapsing volume, which means the move is not supported by real participation.This is not accumulation. It is a loss of sponsorship across credit risk.
Term Structure
The curve is also losing participation.
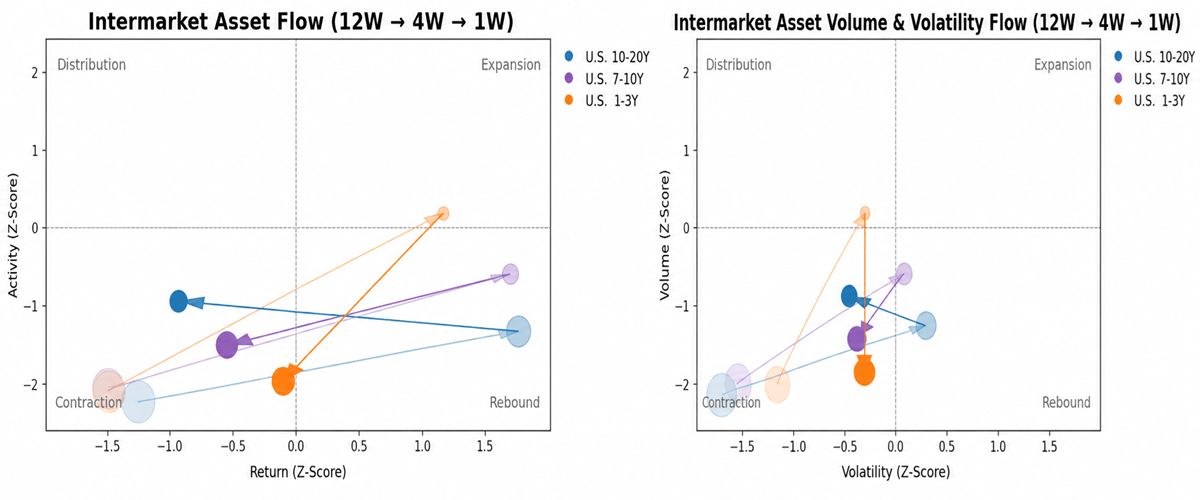
- Short, intermediate and longer-duration bonds all failed to confirm a clean defensive bid. The prior rebound across maturities has faded, and the structure is now moving back toward contraction.
- This matters because a true flight to quality should show stronger activity in duration. That is not happening.
- The bond market is not absorbing capital aggressively. It is also losing depth.
Gold
Gold has moved into the rebound quadrant, but the move is not confirmed by volume or activity. That makes the price improvement tactical, not structural yet.
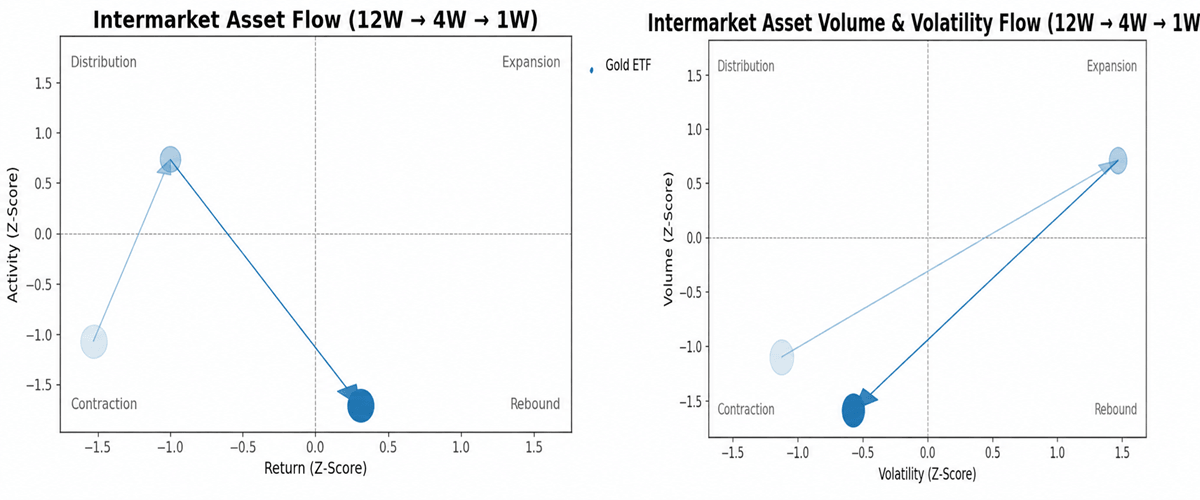
- Gold is holding better, but it is not yet behaving like a confirmed institutional safe haven. The current stability is being produced inside a liquidity vacuum, not through genuine accumulation.
Equities
Russell 2000 and Financials show clear deterioration in participation.
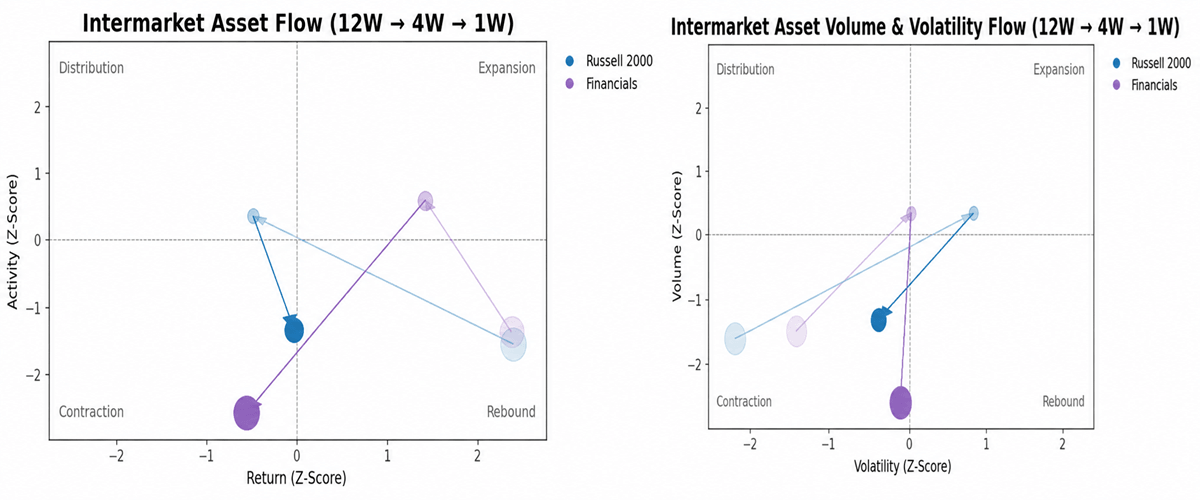
- Financials are the weaker structure: price is already soft, while Dollar Value and Volume are deeply negative. Russell 2000 also shows poor sponsorship, but price has not yet broken with the same clarity.
- The message is simple: cyclical risk is not being supported by broad market participation.
- They are coming from different prior stages. Bonds started from a contractionary context, while equities began the 12W → 4W → 1W path in a rebound environment, and were even in expansion or close to, four weeks ago. Today, equities are in a situation similar to bonds.
Market Conclusion
- The current regime is not a clean rotation from risk assets into safe assets.It is broader and more fragile than that.
- Dollar Value and Volume are collapsing across the intermarket structure, while returns remain mostly contained. That combination tells us the market is not confirming new leadership. It is losing sponsorship underneath the surface across the board. No rotation, dollar denominated, wait and see.
This is not panic yet.
- It is absence.
- Absence of accumulation.
- Absence of institutional depth.
- Absence of clean defensive rotation.
- Absence of price-volume confirmation.
Trading Framework
- Major banks report on Tuesday before the market opens. Therefore, whether you are already positioned or planning to enter, position size must account for this event and be reduced according to the historical volatility of both the individual asset and the broader category.
The setups from the previous article (here) were based on two pillars.
- First, statistical dislocation: Financials and Russell 2000 were far from their 12-week equilibrium levels (time window P.O.C), while QQQ was closer to its own.
- Second, liquidity structure: that relative strength was created inside a market with collapsing participation, not inside a healthy accumulation regime.
- Not only that: both returns and volume were two 𝞼 (standard deviations) away from their historical means, with opposite signs—an extreme statistical divergence- in a zero-volatility environment.
Financials (XLF)
Status: Structural capitulation.
Weekly Key Metrics: Z_Dollar-Value_1W of -2.58𝝈 and Z_Volume_1W of -2.98𝝈.
These assets have two of their core variables in statistically extreme—indeed, highly extreme—territory.
Last week’s report chart, updated as of today.
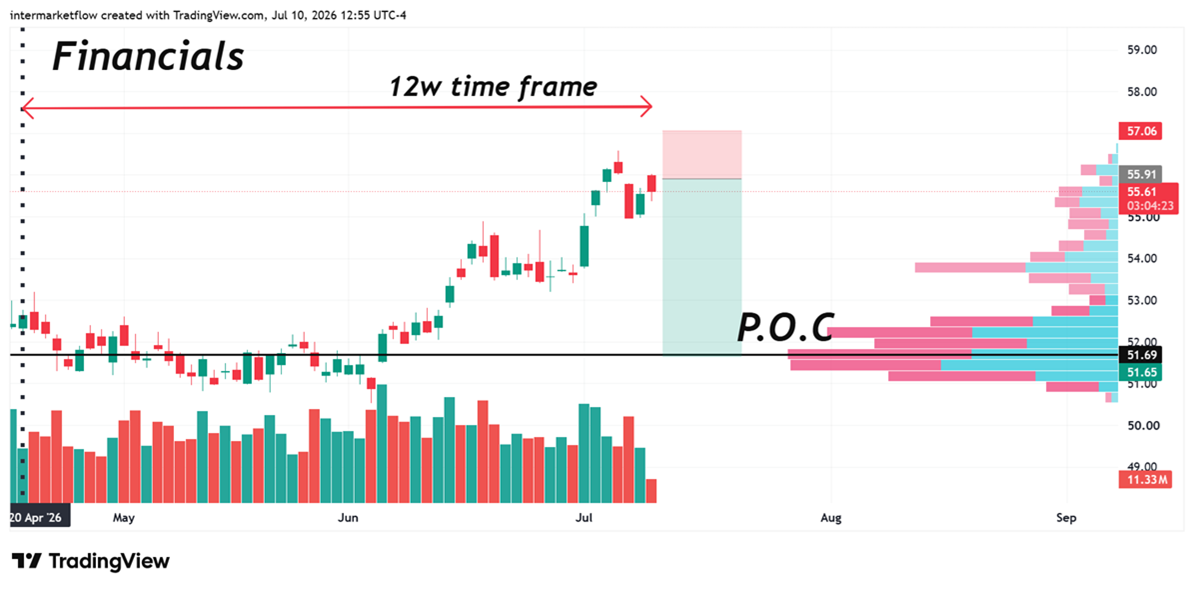
Update: The divergence between price and flow is critical. There is no buyer validation, which invalidates any attempt at a technical rebound. The position must be maintained under strict risk management, with reduced size in Stage 1.
Russell 2000 (IWM)
Status: Persistent contraction.
Weekly Key Metrics: Z_DV_1W of -1.54𝝈 and Z_Volume_1W of -1.32𝝈.
Last week’s report chart, updated as of today.
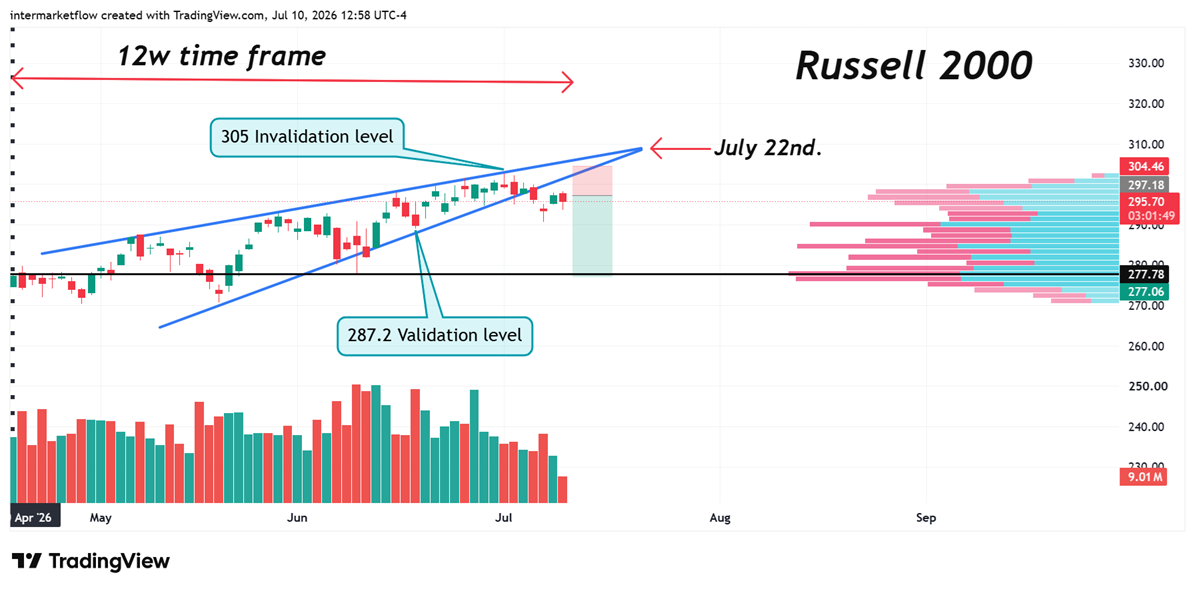
Update: Despite July seasonal expectations, the outflow confirms exhaustion. The long setup is invalidated by the lack of volume-price convergence.
Trade Management Protocol
Confirmation
- A |Z_Volume_1W| > 1.5𝞂 is the definitive signal to validate or invalidate any operational thesis.
- Position sizing is critical in every trade, but especially in this type of setup, where a complete liquidity vacuum, creates the perfect conditions, for stop hunts, prices that trade for only a few seconds, and other features of modern markets.
Execution Filters: Price levels/setups remain subject to the NY open.
- In this context of total illiquidity, stop hunting can be brutal. The Asian and European opens are moments of extreme risk. Absolute price stops, during these sessions and without volume confirmation, must be widened, which forces a reduction in initial position size.
- Same situation for Tuesday reports.
Stage 1 sizing must remain reduced. Stage 2 can only be added after New York confirms both price and volume.
No confirmation. No scale.
Intermarket Flow
Disclaimer: This is our own work, which we have chosen to make public for marketing purposes. It does not constitute financial advice.
If you believe this is an error, please contact the administrator.