The forest.
We group assets to get a broader perspective.This is the evolution from where we were four weeks ago to the flow moves that brought us to where we are this last week.

In the chart on the left, the dimensions are Return and Activity — (Dollar Value, which is Price x Volume). Except for the U.S. Dollar, the main categories managed to post returns around 1-sigma z-scores. The problem is that activity is sitting near -2 sigma in some cases.
In the chart on the right, the dimensions are Volume and Volatility. To quantify this properly, we need to parameterize it in z-score terms. Volume is close to -2 sigma for the week that ended yesterday. This is extreme movement for the time frame historical mean.
This is the context over which the entire analysis will be built: a massive volume exit with extreme z-scores, while returns remain positive but statistically within normal ranges.
Individual Trees: different assets, asset classes and market stages.
What matters in this heat map is that you focus on the first column of each one: 1W Return on the left and 1W Volume on the right.

- Returns are positive: +0.83 for U.S. Equities and +0.86 for Growth.
- Dollar Value is deeply negative: -2.07 and -2.03.
- Volume confirms the same deterioration: -2.01 and -1.94.
This is the first signal.Price is recovering while participation is contracting.
The same pattern keeps repeating on every market rebound: volume only appears when the market is selling. We saw it in last Sunday’s report.
This is the second signal, one we have been tracking for weeks.
This is a selling market.Together, they define the current context: price can rebound, but flow is not confirming accumulation.
Inside the Market: From 4W Stance to 1W Flow

The sector map shows the same message: risk appetite is contracting selectively, not collapsing.
- The month’s leaders are no longer leading. Materials, Technology and Construction led on a 4W basis. This week, Materials and Technology are flat to negative, while Construction lost most of its momentum. The money is not rotating cleanly. It is stepping back.
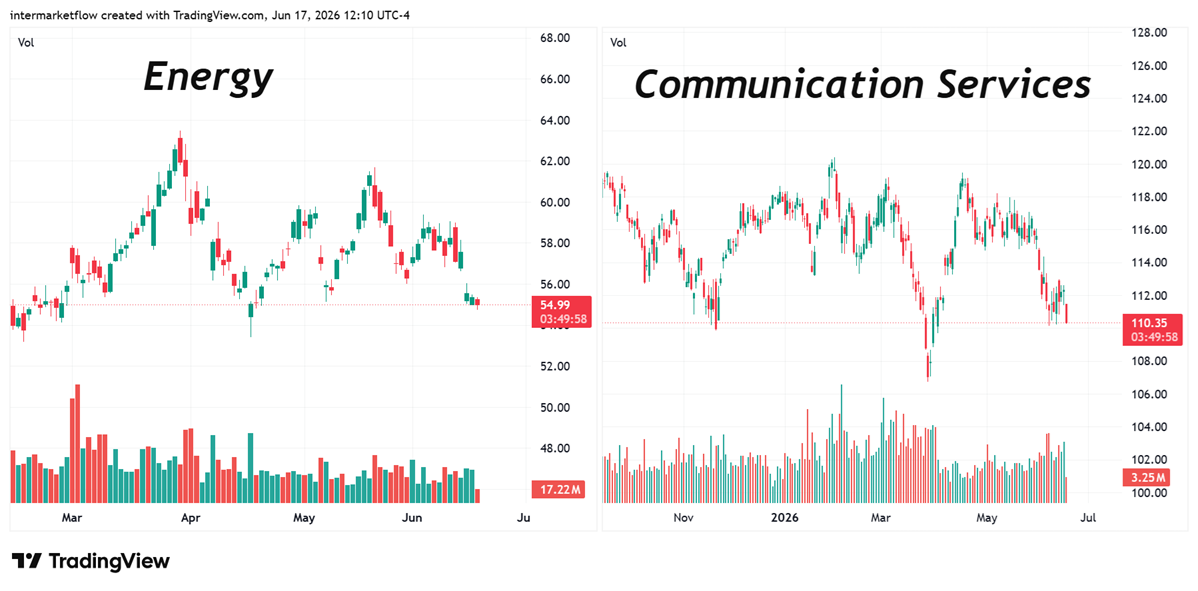
- Cyclicals are split. Industrial still holds at +1.25. Discretionary remains firm at +1.00. But Energy collapses to -2.54. That is not a uniform cyclical trade. It is selection inside the cycle.
- Defensives are not leading. Utilities, Financials and Real Estate improved, but from weak starting points. That is not strong defensive sponsorship. It is less selling pressure.
- Communication Services is the sharpest deterioration on the board, moving from -0.84 one month ago to -2.15 this week. Health is also failing to act as a refuge, with -1.72 and negative readings across all windows.
The key is the time frame. Materials and Technology show negative 1W momentum against strong 4W readings. That looks counter-trend, likely rebalancing. Energy is different: negative 1W confirms negative 4W. That is a trend continuation.
Trading Bias
- At the flow level: this is a selling market.
- At the regime level: risk-off is not confirmed yet.
- At the trading level: selective shorts, not a broad index short.
This is not a market to short everything, nor a market to chase anything. Broad index shorts carry risk because we do not have full risk-off confirmation yet.
The better setup is selective: sector shorts and pair trades.
Best short candidates
Best Buys o worst shorts
- Industrial: do not short; still strong.
- Technology / Materials: wait for confirmation.
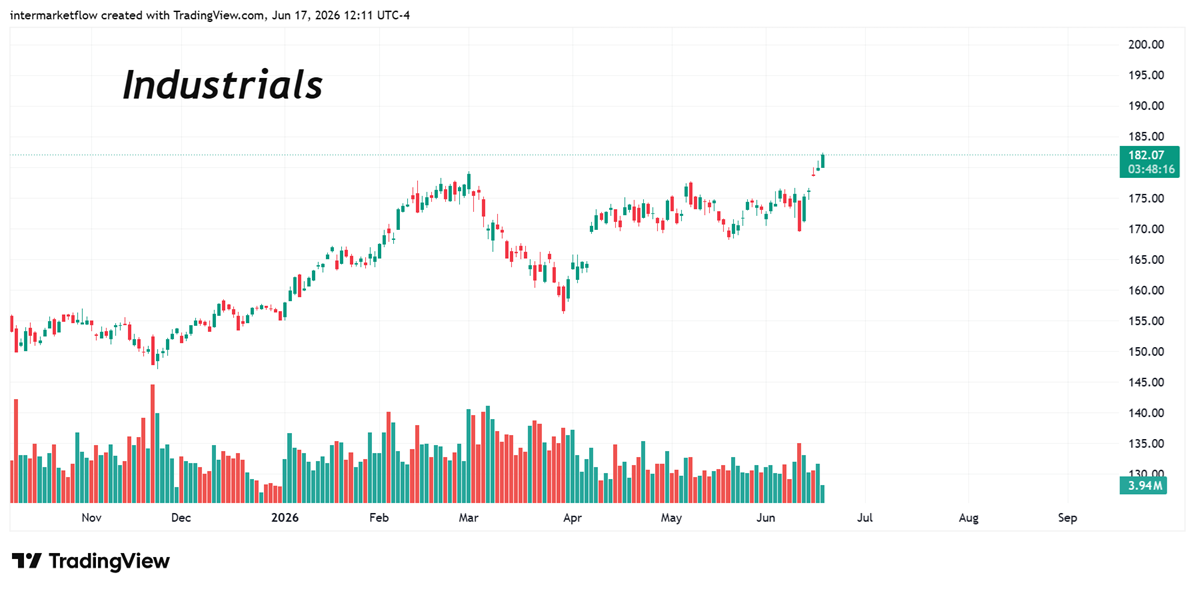
Energy — highest conviction. Cleanest breakdown. Negative 1W and 4W. Trend continuation. Cleanest short-side vehicle: XLE.
Communication Services — second highest conviction. Accelerating weakness. Vehicle: XLC.
Best risk-adjusted trade: Long Industrial / Short Energy. Industry still holds. Energy is breaking down. Both are cyclicals, so the pair reduces broad market beta and isolates the internal divergence.
Bottom Line
Do not chase the rebound. Do not short the whole tape.
Shorting requires a certain risk appetite that does not always fit institutional portfolio management. Still, portfolio managers can — and should — adjust the implicit risks embedded in their portfolios.
Intermarket Flow
This is our work. We choose to make part of it public for marketing purposes.
It is not financial advice.
If you believe this is an error, please contact the administrator.