Here you will find:
- The different stages of analysis every trader must go through, starting with identifying the macro cycle and the dominant macro narrative.
- The data and research we’ve been collecting that helps pinpoint where we are in the cycle.
- Why recessions and stagflation behave in completely different ways.
- Why trading during stagflation is the most challenging environment for any trader.
- The probabilities the market is assigning to a rate cut in December—showing the uncertainty we’re navigating and the clash between the dominant narrative and the emerging one.
- The practical playbooks for trading recessions and stagflation.
- Current P/E valuations versus historical averages across indices and sectors.
- This week’s market rotations and why we saw a clear risk-off move by company type and sector.
- A concise overview of Five Below.
- A full technical setup for the stock.
Recession and stagflation are similar business cycle phases, but they trade in completely different ways.Relative sector valuations always reflect the phase of the macroeconomic cycle the real economy is in—or at least the stage the market believes it’s in.
This creates a set of challenges when trying to operate effectively in financial markets.
1 Regarding the real economy:
• Identifying which phase of the macro cycle the real economy is currently in.
• Understanding the reaction function of monetary policy—and, more importantly, how these policies will shape the macro cycle.
2 Regarding the markets:
• Understanding today’s dominant market narrative, and especially identifying which stage of its life cycle it’s in. Is it beginning? Is it ending? We saw it here. Naturally price behavior is key to identifying it.
• Understanding the macro narrative that is trying to replace the dominant one.
These are independent analytical layers, yet fully connected when it comes to the future state of markets.
The macroeconomic cycle today: where we stand and what dynamics we can expect
We know that:
• Consumer-credit portfolios are in serious trouble, with delinquencies and losses—some already above 2007 levels. We covered this here.
• We know that 90% of this entire credit segment is held by four large banks. We showed that here.
• We know that delinquencies in residential and commercial mortgages are also elevated and rising. We covered this here.
• We know that small banks are exposed as well, pushed by fintechs and large banks into worsening the quality of their loan books in search of profitability. We went through that here.
• We know the real-estate market is over-inventoried, with low sales and the worst affordability conditions on record. The monetary-plumbing system—through MBS—is preventing liquidity issues at small banks and keeping construction going by ensuring credit continuity. Last article
• We know what the leading indicators (yield curve, building permits, etc.) are all signaling. We saw all of them in the blog.
• We know unemployment increases are coincident with recessions. We covered this here.
This is not trivial. This economy is not in expansion, and it’s certainly not in recovery.
The real question is understanding the actual pace of the downturn—and whether we’re already in a recession or in full stagflation.
Recession and stagflation are traded in completely different ways.
Recession: activity falls and inflation comes down. The central bank can ease, and markets usually reprice risk through lower rates and weaker cyclicals.
Stagflation: activity falls but inflation stays high. The central bank is trapped—can’t cut, can’t hike—and the pricing of risk, real rates and sector leadership becomes much more complex. Does anyone see any similarities with today’s environment?
Just in case, here are the current market-implied probabilities for a rate cut in December.

Today, the futures market is basically flipping a coin to decide whether we get a cut or not. This is pure uncertainty—and there’s nothing markets dislike more than uncertainty. A new macro narrative is pushing hard to displace the dominant one. And if you remember, previous rate-cut cycles had far higher levels of certainty well before the actual decision date.
In short: recession is a clean slowdown; stagflation is a slowdown with inflation glued to the system.
Recession or Stagflation: For traders, the implications are completely different
In a recession, the playbook is clear: rates fall, duration wins, defensives outperform, cyclicals lag and liquidity conditions improve as the Fed eases.
In stagflation, nothing is clean: rates stay high, real yields become the key driver, risk premia widen, sector leadership rotates violently, and both bonds and equities can sell off at the same time.
This is the challenge—the current economic environment presents to us today.
Sector and market valuations

Recession and stagflation:Sector and market valuations

Recession or stagflation, the consumer-discretionary sector is one of the clearest gaps between market pricing and real-world conditions today. Looking closer, an inflationary environment hits low-income and lower-middle-income households the hardest.
Let’s look at a few charts from the companies targeting this segment to see what they’re telling us.
Recession or Stagflation: Discretionary Sector

Weekly moves between company types

Returns across small-cap names—whichever way you measure them—point to a clear risk-off week. Especially when compared with large caps. Capital rotated out. From this perspective, from small risky companies to big and safer companies. A clear Risk-off move.
Weekly mover from and Inter-sector perspective
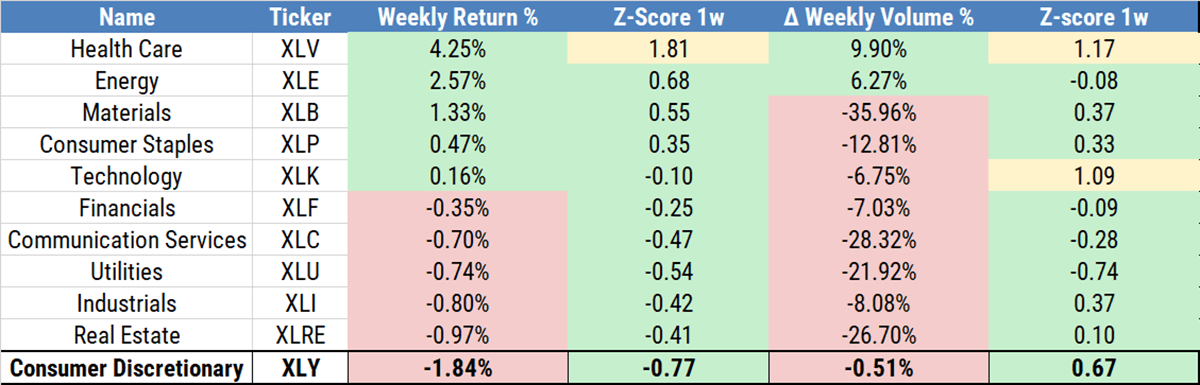
In a week we can clearly call risk-off, the largest outflow came from the consumer-discretionary sector, both in returns and volume.
Intra-sector: Discretionary names targeting low-income consumers

The two below—companies with the weakest returns and matching volume outflows. No divergences here; the flow is one-way direction this is the way out.
Lets go Technical
Five Below (FIVE) is a U.S. value-retail chain targeting teens with low-price discretionary products. Founded in 2002 and based in Philadelphia, it operates ~1,770 stores and generated ~$3.9B in revenue in FY 2024. Net income fell to $253M from $301M, signaling margin pressure. The company carries ~$2.0B in debt with a ~105% debt-to-equity ratio, reflecting high leverage.
For traders: Five Below faces margin pressure and falling comps. Growth depends on store expansion, while high debt adds risk. Key drivers: comps, margins, inventory discipline, and import costs(tariffs!).


Twenty, twenty-five years ago, with far less than this, I would’ve asked her out.
I’m older now and I can’t recommend trades. This is one of the 5/6 setups we’re developing for the week ahead. We share it purely for marketing purposes.
Martin
If you believe this is an error, please contact the administrator.
3 Responses