How the acceptance of MBS as collateral is distorting supply, demand and the real price of housing.
The recent SOFR spikes last week caught the market’s attention — we wrote about them here. Now that the situation seems to have calmed down, likely tied to the ongoing government shutdown (which keeps collecting taxes that pile up in the TGA within the Fed, draining liquidity from the system), we began analyzing the liquidity requests that triggered those rate spikes to better understand what’s behind them (SOFR). Here’s what we found.
MBS: Liquidity and Residential Prices
When a bank turns to the SFR for liquidity, that request must be collateralized. Here’s the collateral used during the latest SOFR peaks:

Liquidity: When we broke it down by type of player, here’s what we found
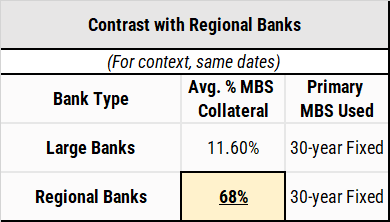
Regional banks are using MBA (Mortgage-Backed Assets) with 30-year maturities as collateral — in other words, they’re offloading long-duration, high-rate-risk assets at face value (100). The Fed applies no haircut on this collateral, even though rates today are clearly much higher — in other words, the Fed is assuming private-sector losses.
The Liquidity System and the Housing Market
- A bank or lender originates a mortgage (a family buys a house)
- The loan meets “agency” standards (LTV, FICO, DTI, documentation)
- Fannie Mae or Freddie Mac buy the mortgage — paying the bank its value and freeing up liquidity.
- They bundle thousands of similar mortgages into a pool and issue a Mortgage-Backed Security (MBS) backed by that pool
- That MBS goes back to the market — sometimes to the same bank, other times to funds, insurers, or the Fed
- The bank now holds a liquid, agency-guaranteed asset that it can:
• keep in its portfolio,
• sell on the secondary market, or
• post as collateral to the Fed for liquidity (at par, with no haircut), with losses that are already real — even if they’re not yet reflected on the books. They just make money by asking for liquidity.
MBS: The Cycle Starts Again
- A builder takes a bank loan and builds
- A buyer gets a mortgage from that same bank (or another lender)
- Fannie/Freddie buy the mortgage and turn it into an MBS
- The bank regains liquidity, which it can lend again to builders
- The Fed accepts those MBS as collateral → keeping the cycle running
Market Dynamics: Supply, Demand, Inventories and Prices

Housing inventory has three stages: Completed, Under Construction, and Not Started. The problem lies in that “Under Construction” is a broad term — projects could hit the market in a month or ten. The total number of projects that can no longer be halted stands at 1,332,700 units.
In summary:
- There are 490k units currently for sale, already an unhealthy number for a growing economy
- About 144.6k units are completed each month — entering the market
- 113.3k new projects are started monthly
- Across the entire pipeline, there are 1.33 million units in progress.
These figures are staggering. The real issue is that only 56k–58k units sell monthly and most buyers are investment funds purchasing homes to rent them out for yield. Roughly 40% of what enters the market actually sells, meaning inventories are rising — something builders are already seeing and starting to slow down, as reflected in the data.
Conclusions: The Fed is cornered — it can’t step back without breaking the system
- If it stops accepting MBS as collateral, liquidity in regional banks collapses
- Forced MBS sales would flood the market and sink prices
- Builders would lose financing, freezing new projects
- Housing prices would finally adjust — revealing how inflated they really are
The idea is to understand how the monetary plumbing system prevents markets in imbalance from adjusting naturally — creating massive moral hazard and unintended consequences. One of them is the worsening affordability for anyone trying to buy a new home.
Unlikely scenario? The Fed stops accepting them.
Regional banks, homebuilders, rental funds, and suppliers are all exposed — and the tickers tell the story:
- Regional Banks: FRC, ZION, NYCB — all heavily loaded with MBS on their balance sheets.
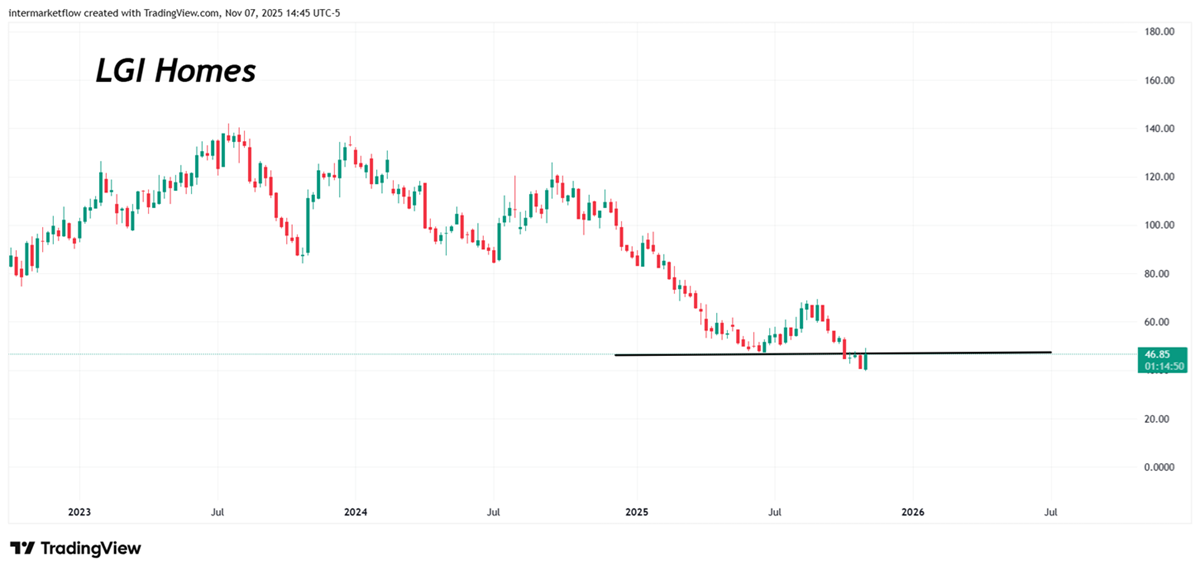
- Homebuilders: KBH, LEN, LGIH — high inventories, short-term debt, and reliance on MBS-backed credit.
- Rental Funds (SFR): INVH, AMH, BX — leveraged through MBS-linked debt, facing refinancing pressure.
- Suppliers: BLDR, SHW, MAS — dependent on builders’ demand; first to feel the slowdown in new projects.
Together, these names define the fault lines of the housing-finance loop — a system that still looks stable only because the Fed keeps it on life support.
If you think back, we’ve been talking about the weakest sectors for quite some time — construction, real estate, and financials.
In fact, we’ve been covering them for almost a year now.
A curiosity I thought was worth sharing
Michael Burry, a contrarian investor whose methodology I don’t really know, became famous by being the first one who shorted back in 2008. Actually a movie was made about this called “The big Short”. I assume all of us have seen it at least twice.
We wanted to see how the technical analysis lined up with a trade of this kind. Here’s what we found.
Just in Case PLTR — is currently the most highly valued company in the AI space

On-Balance Volume is an indicator I use a lot. Like most good things, it’s extremely simple. On positive days, it adds the day’s volume; on negative days, it subtracts it. Of course, it has its weaknesses, and like any indicator, it’s just one more piece in building a setup.
It gives you a sense of how crowded the trade is compared to its past. Well, this trade has never been as crowded as it is now, and the divergences it’s been forming keep growing — in other words, increasing weakness.

I don’t think I’ve ever seen oscillators this beautiful. Miles ahead — we stopped to rest and eat. Time to get going. As if that weren’t enough, they’re also in divergence. They’re simply sexy.I know — he’s trying to catch a top, and yes, the market can stay irrational and all that. But for a purely technical analyst, it doesn’t get any better than this.
These are the charts we’ll be running a full technical analysis on. We’ll send one or two out midweek.
All of them are in line with our dominant macro thesis
Banks


Construction


I could go on and on…
Everything you’re seeing is on the weekly timeframe.
Lots of work ahead. See you,
Martin.
If you believe this is an error, please contact the administrator.
4 Responses