In recent days, the SOFR rate (Secured Overnight Financing Rate) has shown several spikes despite the increase in repo market volume. This happens when, even with activity, the demand for liquidity exceeds the available supply. More institutions need cash to fund themselves using Treasuries as collateral, but few lenders are willing to provide it at low rates. The natural outcome is a rise in funding costs. Here’s what happened.
Here we can see the spikes in SOFR rate over the past few days

Of course, every time this happens, we all raise an eyebrow — what just happened? To understand it, we need to go back to the plumbing system of the four buckets.
Let’s refresh how the monetary plumbing system works. A refresher here
.")
The repo market emerged naturally as a result of banks’ daily operations. Whenever they face liquidity shortages, they turn to this market to fund themselves with other banks, at least at first option. The price that balances this market — where liquidity is traded — is the SOFR rate.
SOFR rate: The heart of the private credit system
Why?
Because if a bank’s funding cost rises from 4% to 6%, for instance, its costs have increased by 50%. That additional cost inevitably gets passed through to private credit, just like it would in any business with the same pricing power.
Of course, the Fed knows this. That’s why it created a valve called the Standing Repo Facility (SRF). In moments like this, it opens the tap and lends at the rate consistent with current monetary policy.
For example, if SOFR jumps to 6%, the Fed steps in and offers liquidity at 4%. Naturally, banks will use that facility until supply and demand for liquidity in the interbank market normalize — bringing SOFR back to the level the Fed targets through arbitrage.
This mechanism prevents banks in need of liquidity from being forced to sell assets at fire-sale prices, which would weaken their balance sheets and risk triggering a broader run on the banking system.
SOFR rate analogy
The Repo Bucket ran out of water, so the Fed opened a valve to refill it and keep the SOFR rate where it wanted it to be.
SOFR rate and Collateral
One important detail — when banks go to the Fed for funding, they must present collateral. The Fed needs to ensure repayment. That collateral is usually Treasuries, but not always.
During the last regional banking crisis, the Fed accepted MBS — mortgage-backed securities — as collateral. Does that ring a bell? A ninja movie we already watched back in 2008, during the GFC, perhaps…
In the end, the Fed wound up holding collateralized mortgages on its balance sheet — a complete absurdity.
These are the liquidity requests we’ve seen in recent days

A lot? A little? Relative to what?
Here are the historical liquidity requests — just to put the current level in context.

It doesn’t seem that low in historical terms. There are a few mitigating factors that could help explain these liquidity requests:
• QT: of course — it’s been draining liquidity from banks, making them more reluctant to lend their cash.
• Quarter-end: also true — it’s a period when payment intensity rises for several reasons that aren’t worth detailing here.
Let’s assume these are the reasons, for now
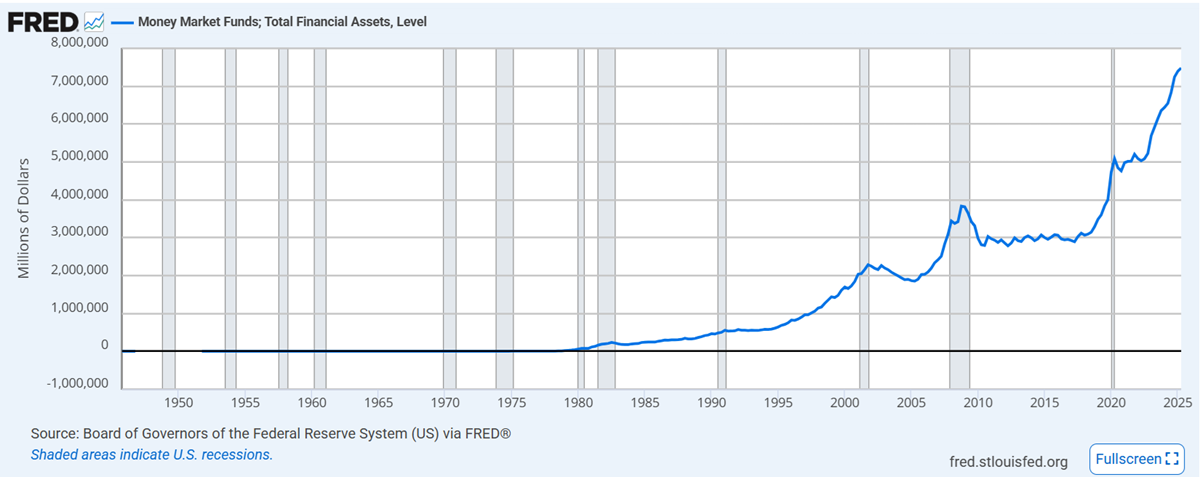
Now, let’s move to the liquidity bucket — the one where banks, funds, pensions, and primary dealers park their excess cash in exchange for a rate set by the Fed. This bucket is the Reverse Repo market.
Let’s see how much water it has left

It’s at zero.
Basically, there’s no excess liquidity left in the market — and that shortage clearly shows up in the limited supply we saw in the repo bucket. Remember, this lack of available cash is what caused the recent spikes in SOFR. In the end it is a closed system.
The obvious question follows: why is there no liquidity?
Well, banks are simply placing their excess funds elsewhere or using them for other purposes. Where that money goes defines the broader economic picture.
Possible destinations for this liquidity:
- Risky bets. Could be — just look at asset prices across the board: S&P 500, BTC, housing, and so on.
- Real investments in the economy. For instance, A.I. Possibly. But wasn’t A.I. supposed to be financed with the companies’ own cash flows?
- Holding liquidity just in case. Are they anticipating credit losses ahead?
- Government shut down and accumulation in the TGA account
Some clues
We know the banking system has no liquidity. Let’s see what happens in the private sector.
It’s full of it. The point is that banks don’t ask the private sector for money — it’s the other way around. So, by elimination, we narrow the problem exclusively to the banking system. To the plumbing of the banking system.
All the information presented is public and accessible. Source: FRED, Federal Reserve Bank of St. Louis.
So, what do we do now?
Let’s run a statistical analysis on equities, bonds, currencies, and commodities to see where that money went.
SOFR rate situation and the markets for the week ending October 31
We want to understand what’s happening in the banking sector — or at least see how the market perceives its current state.
From the general to the particular

This week we sent out the technical analysis of the construction sector here. I want to highlight the massive exit from real estate — not only because its return shows a Z-score of 1.88, far from its mean, but also because this move comes with a volume increase standing 2.13 standard deviations above its average. In other words, an extreme move in both return and volume, signaling a broad exit from the sector.
The construction sector also saw a strong move, though not as extreme as real estate.
Notice that the financial sector is still not showing major issues — which is odd, considering what we’ve seen above and what we know about the state of their loan portfolios.
To the particular: Constructors

Well, not a single one was spared. The weekly returns say it all. To gauge the magnitude, you have to look at the Z-scores in each case.
To the particular: Small Banks

ufff…..
And the Big Ones
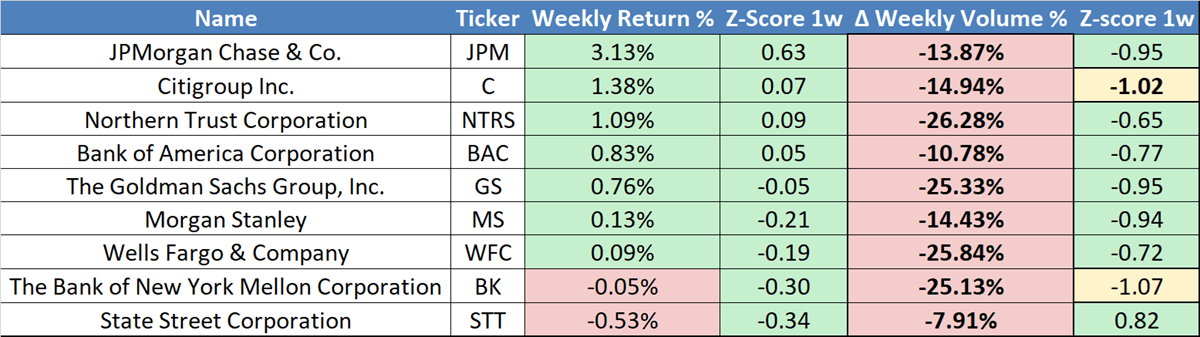

Among the smaller ones, the bleeding is total. As we’ve already seen here, that narrative is misleading — there are four major players heavily exposed to consumer credit. However, the drop in volume is widespread, which tells us those returns are not confirmed.
There are confirmations in the construction sector and early opportunities among the big banks. That’s where the technical analysis we’ll send on Wednesday is headed, God willing.
Martin
If you believe this is an error, please contact the administrator.