The Spot federal rate spread vs. PCE inflation rate will determine the dollar’s path in the short and medium term. Here we break down the capital flows of the week, the Fed’s actual situation, today’s market expectations, the budget constraint set by the PCE and the concrete technical setup we are working on.
Tracking capital and interpreting the market’s reaction. Closing prices as of Thursday, 6 PM New York time.
We will interpret the weekly closes up to and including Thursday the 18th. Our aim is to strip out any bias we might have.
Two sentences per table to describe them in general terms and make the reading more user-friendly. (Just in case someone wants to catch up on z-scores)
1.Risk On!

A clear signal: high-yield bonds outperformed, but volume is flowing out across the board.
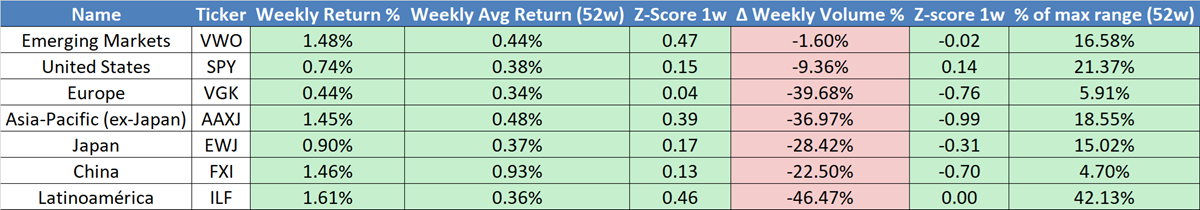
By Market type
Emerging markets outperformed this week—risk on! Yet volume collapsed everywhere except in EM and the U.S., where it only slipped 10%.
By company size
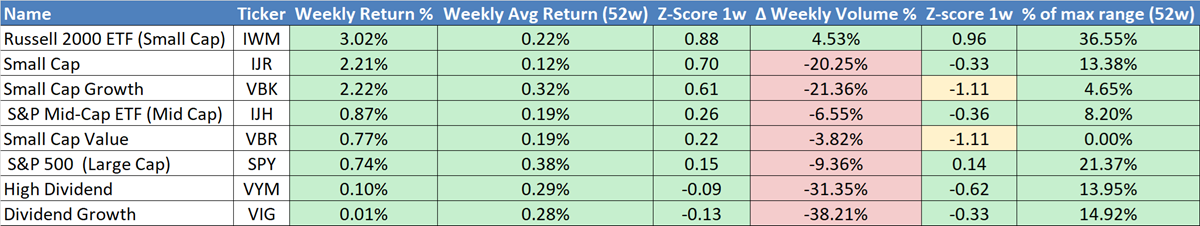
Risk on: small caps outperformed, but the rally isn’t confirmed by volume.
By sector
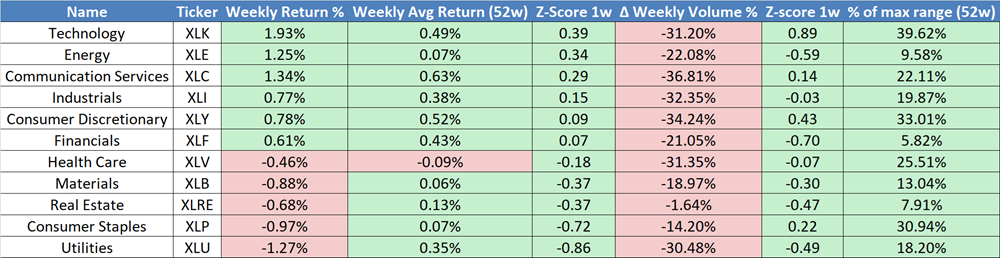
Risk on: cyclicals are rising, but volume collapsed across all sectors. Defensives are falling, and beaten-down sectors can’t keep pace.
Bigger Divergences
We’re tracking assets across spot, options, and futures. The table shows this week’s largest bearish divergences—under review obviously, though we’re only trading FIVE.
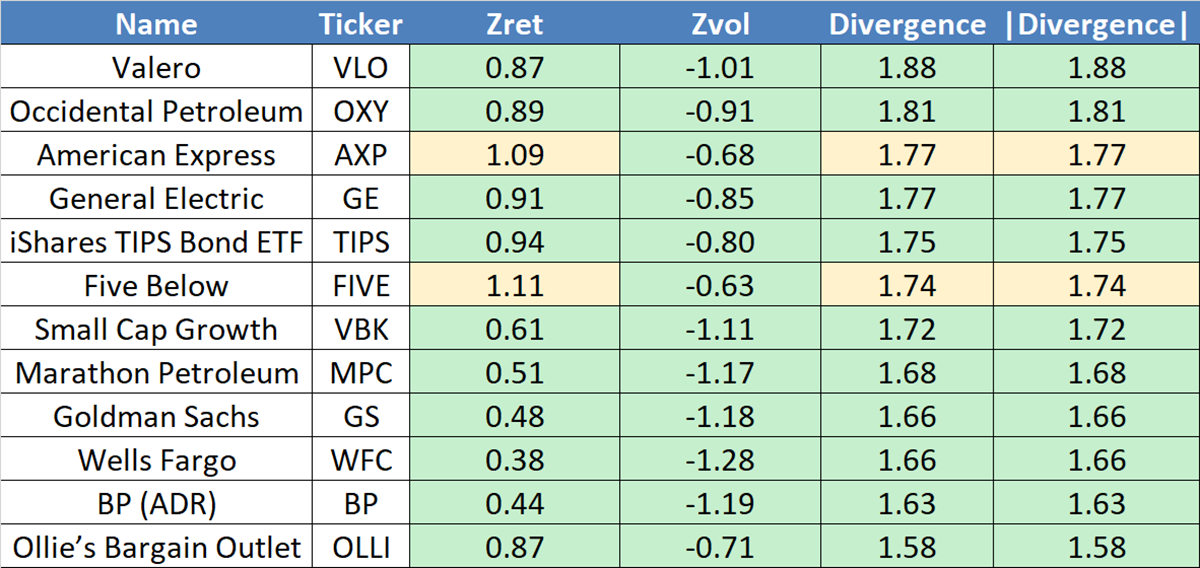
Important: Look at American Express and FIVE. Both had extraordinary returns this week—completely out of the ordinary.
The same happened with volume, a lot more extreme, but in the opposite direction.
To sum it up, risk-taking is widespread, but the markets are getting increasingly thin. These are facts, not opinions.
Spot federal rate spread vs. PCE inflation rate
On Wednesday we saw yet another classic case of “buy the rumor, sell the news.” We had been signaling it with the probabilities coming from the futures market. The cut came, and the next question is: what happens now with short-term rates?
Today’s market outlook
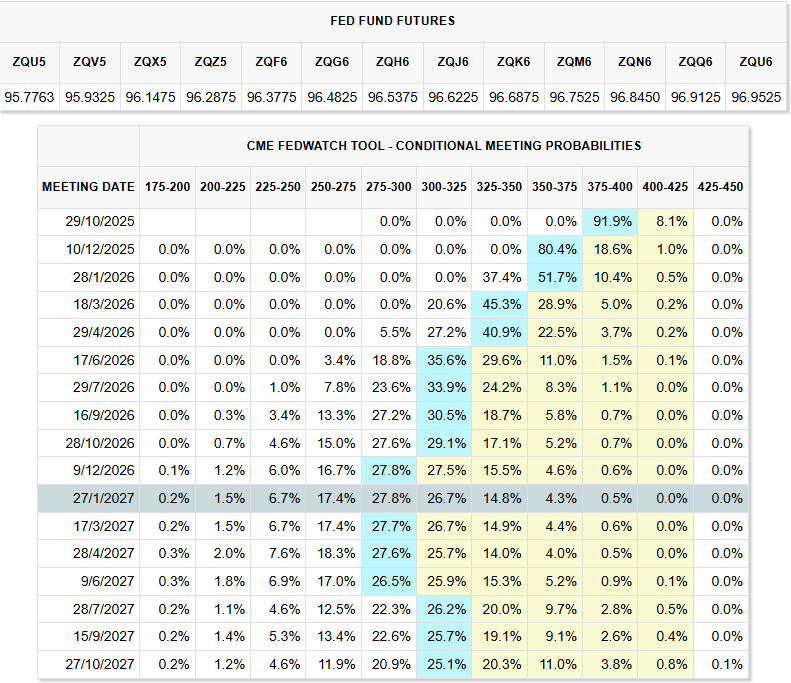
As you can see, the market is almost certain about a 25 bp cut for the October meeting. On top of that, it already has a fairly firm view of the rate path through April 26.
The Fed’s outlook
The problem today is that the Fed does not share the same level of certainty the market is showing.
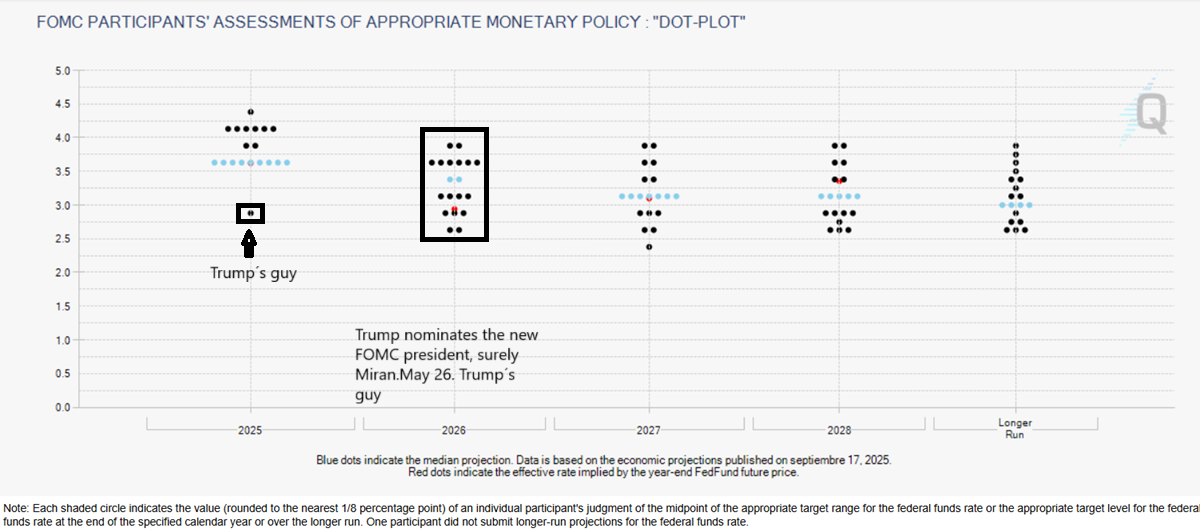
For 2026, the Committee sees rates between 4% and 2.5%—a huge dispersion.Stephen Miran (Trump’s guy) will be Chair, Powell still on the FOMC though.
Could this mean a more dovish Fed? For now it’s irrelevant—the Fed has no clear path, unlike the market’s certainty today.
Spread Spot Rate and P.C.E. (Personal Consumption Expenditures Price Index)
As we know, this is the Fed’s preferred inflation gauge, given several key differences from the CPI. It essentially captures the substitution adjustments consumers make and gathers data in a much more consistent way.
Spread spot federal rate vs. PCE inflation rate: Dollar Big Picture
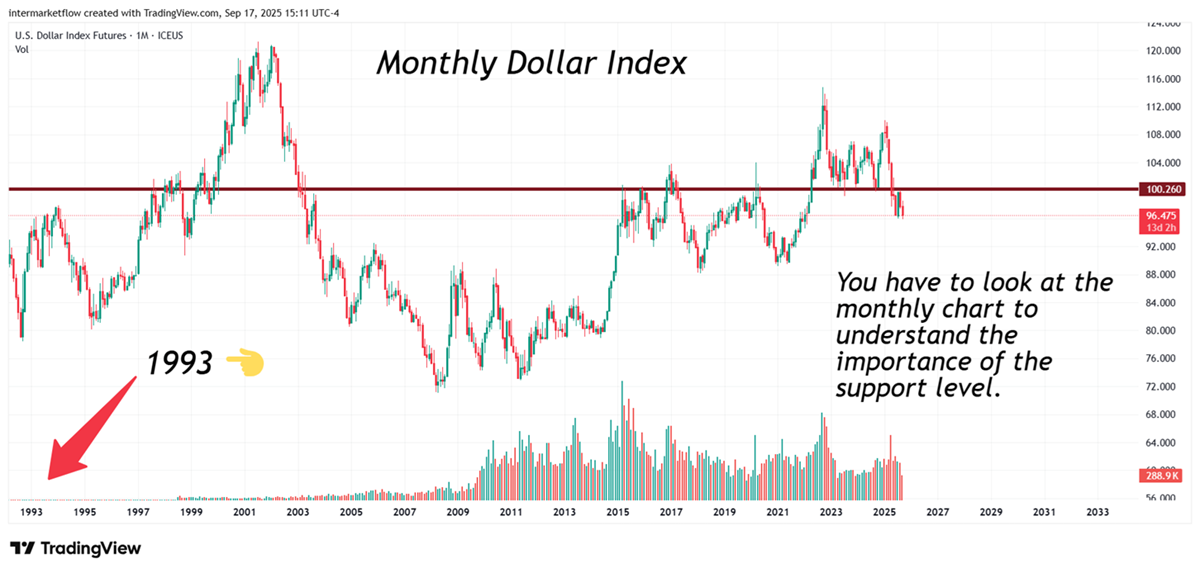
Technically, the dollar is at an inflection point. It broke and is now retesting a key support zone around the 100 level.
Spread spot vs. PCE inflation rate: The budget constraint imposed by the PCE
Spread spot vs. PCE inflation rate: Real interest rate and money markets
Money markets today. We need to keep this chart in mind to grasp the potential scale of capital flows.
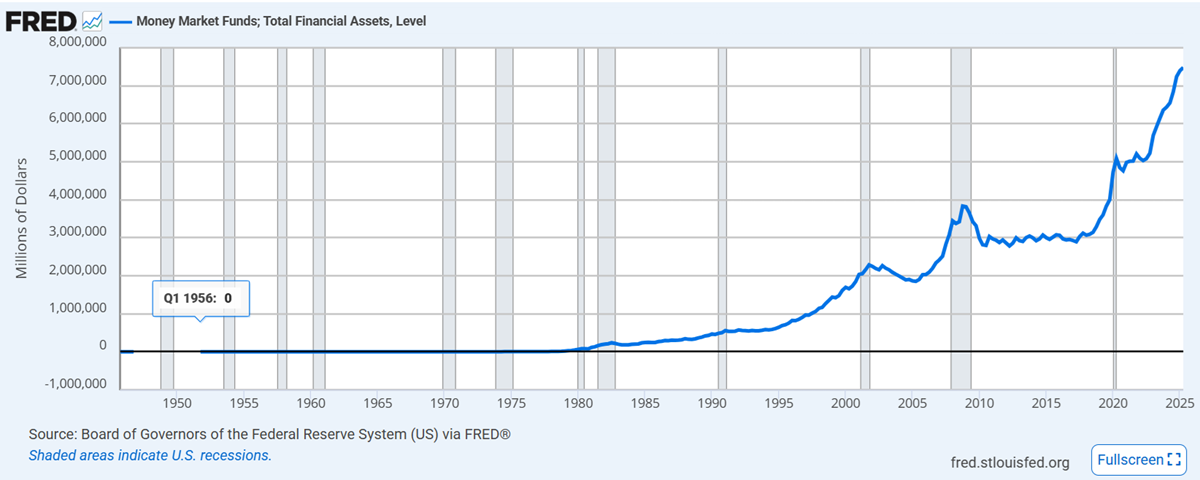
Money Markets Today. Source: FRED
Spread spot vs and P.C.E rate of inflation
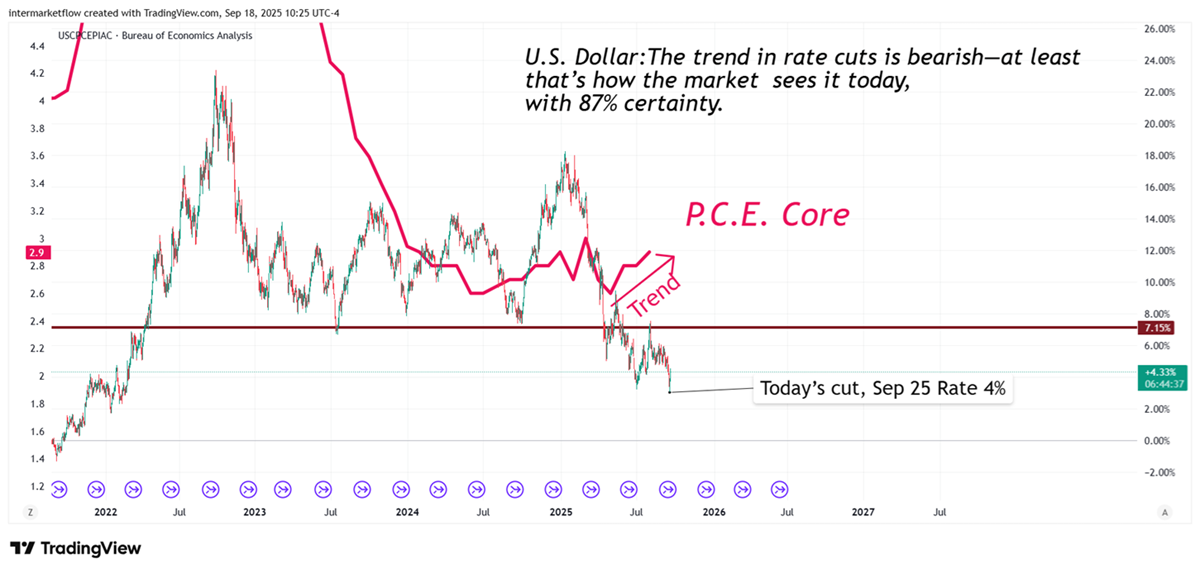
The trend of both variables today is clear. So is the causality.
Spread spot vs and P.C.E rate of inflation: Starting scenario
Today’s values give us the snapshot—already priced in. It’s like a company’s balance sheet. What the market anticipates is the movie. What it sees are the trends: the direction, and above all, the growth rates. First and second derivative, in mathematical terms.
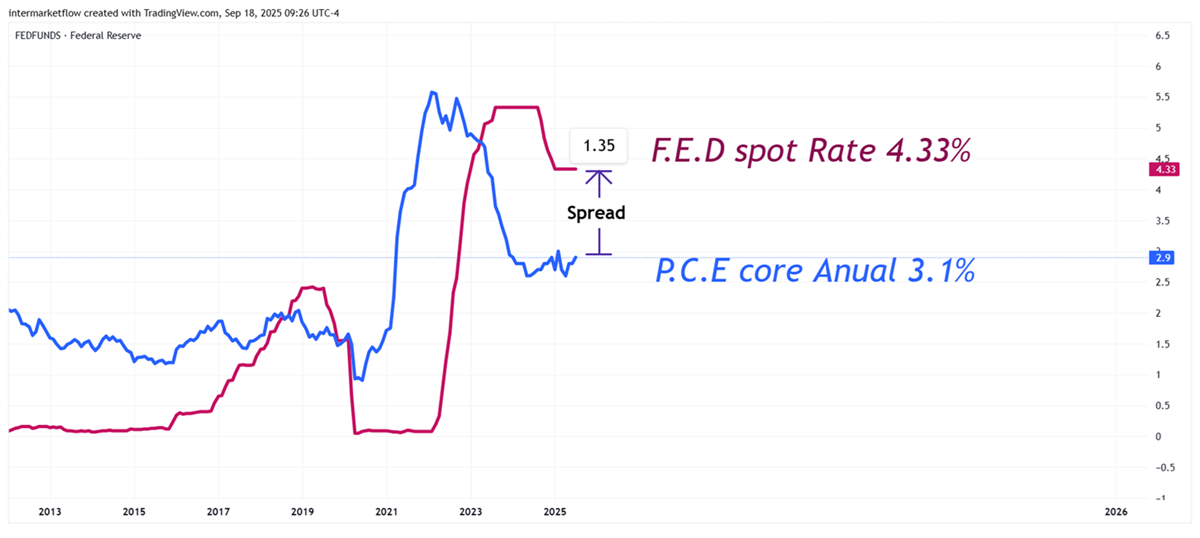
Spread spot vs. PCE inflation rate
Today both variables move in opposite directions, with a 1.35% spread. This opens scenarios with the potential to trigger massive capital flows.
Scenario under study here: If the spread turns negative
A huge pool of liquid, dollar-denominated money would be directly hit—likely unleashing large-scale flows.
Why this scenario is likely
- The Committee already leans dovish, and this could deepen in May.
- The market is pricing in two cuts by year-end, bringing rates near 3.5%.
- The PCE stands today at 3.1%.
Spread spot vs. PCE inflation rate: Macro risks for inflation
- The effect of tariffs—a debate revived by today’s political climate. Past empirical evidence is quite clear about their inflationary impact on the long run.
- Fiscal deficit: a constant money injection with no offset, dripping into an already full glass—as bond markets suggest.
Spread spot vs. PCE inflation rate
In short, is this a possible scenario?
We believe so. Yes.
The effects of a devalued dollar and the most likely destinations in this scenario
There are asset classes more sensitive to this scenario. This causality is, of course, not linear—nothing in economics is. What it is, though, is directional.
Spread spot vs. PCE inflation rate
The connection with commodities, commodity currencies, emerging market assets and emerging market debt.
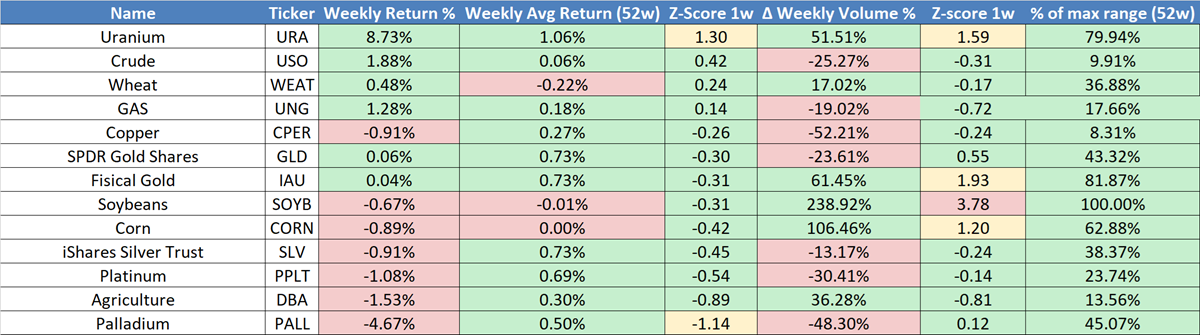
For now, the only concrete point is that many are near or at 100% of their average weekly volume range, using a two-year sample.To clarify, many are at their maximum weekly volume ranges.
Where’s the action? Where did the rotation go?
With today’s information, they look like the most likely destination for intermarket flows.
Again, caution—there’s a mountain of money in money markets!
If you believe this is an error, please contact the administrator.
See you next Sunday, God willing.
Martin