Here you’ll find:
- How Homebuilder and Real Estate sectors diverged since the yield curve inversion, relative to the S&P 500 Equal Weight
- The evolution of U.S. housing starts over the same period
- Market data showing the imbalance between supply, demand, and existing inventory
- Sector statistics highlighting the companies with the sharpest capital outflows
- Technical snapshots of several sector names at different stages: FOR, JHX, OC, TOL, TPH, and LPX
From the big picture to the details: How Homebuilders (here for more details) and Real Estate (here for more details) are evolving against the S&P 500 Equal Weight.
The market is currently pricing these probabilities into rate cuts. Check it out here
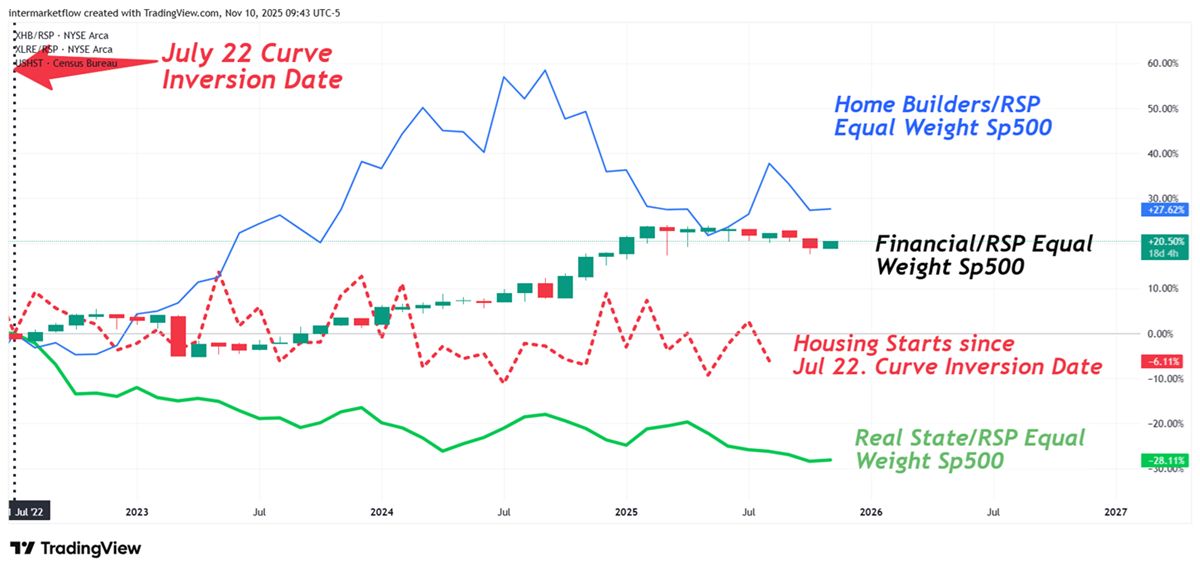
Starting point: July 2022 — the moment when the yield curve inverted and the economy entered a new stage of the cycle.
- Ratios between Homebuilders, Real Estate, and Financial sectors, with the S&P 500 Equal Weight as the denominator
- The red dotted line shows the evolution of U.S. housing starts since that date
It’s clear that the Real Estate sector shows the greatest weakness — likely already priced in — while Home Builders have gained 27% relative to the S&P 500 Equal Weight.

In a context where:
- Housing construction is falling
- 113K new units enter the market each month on top of an existing 490K inventory
- Only 48K units are sold monthly
- 1.3M units more are still in the production pipeline
Homebuilding: The most extreme weekly moves within the sector

Looking at the Z-scores of capital flows, returns, and volume, it’s clear how exceptional this move is compared to its own history.
Technical Analysis: Choosing Vehicle inside the Homebuilding Sector
A few snapshots of the trades we’ve been watching.Technical setups vary widely depending on each company’s niche.

It’s a solid starting point, aligned with the macro backdrop — Texas is one of the states with the largest inventory buildup

This risk/reward doesn’t fit our strategy

So close — four days behind the move. The challenge now is finding where to jump into a move that’s already underway. That’s where the Fibo levels come in.

Sexy P/L. on this one we went deep.


As you’ll see, there are trades here for different methods and trading systems. None of them are random — we reviewed 15 to 20 similar setups before selecting these.
The views you see here are just that — our opinions, based on our own trading approach. There are many paths on the Lord’s road… I imagine you’ll find yours.
That’s all for today, gentlemen. Plenty of work ahead. I hope this adds value — and as I always clarify, this is our actual work, shared here for marketing purposes.
Martin
If you believe this is an error, please contact the administrator.