Here you’ll find:
- The identification of sectors showing weakness
- An analysis of the financial sector as a whole through XLF
- A list of the most beaten-down banking stocks of the week
- A selection of two with the most extreme Z-scores
- A complete setup where the technical signal has already triggered (INBK)
- An option for traders who focus on breakouts ( NWBI)
For some time now, we’ve been analyzing each sector statistically.. We present a summarized version of this every Sunday in our weekly report.
Within this analysis, we also track all stocks, ETFs, options, and futures listed in U.S. markets—always aligned with the macro and intermarket hypothesis we’re currently operating under. As usual, before a trade I always check this. Rates probabilities as of today in the future markets. It defines our reaction function.
We’ve identified clear weaknesses in real estate (XLRE), construction (XHB), and financials (XLF). Our next step is to look for a suitable vehicle
XLF as a sector
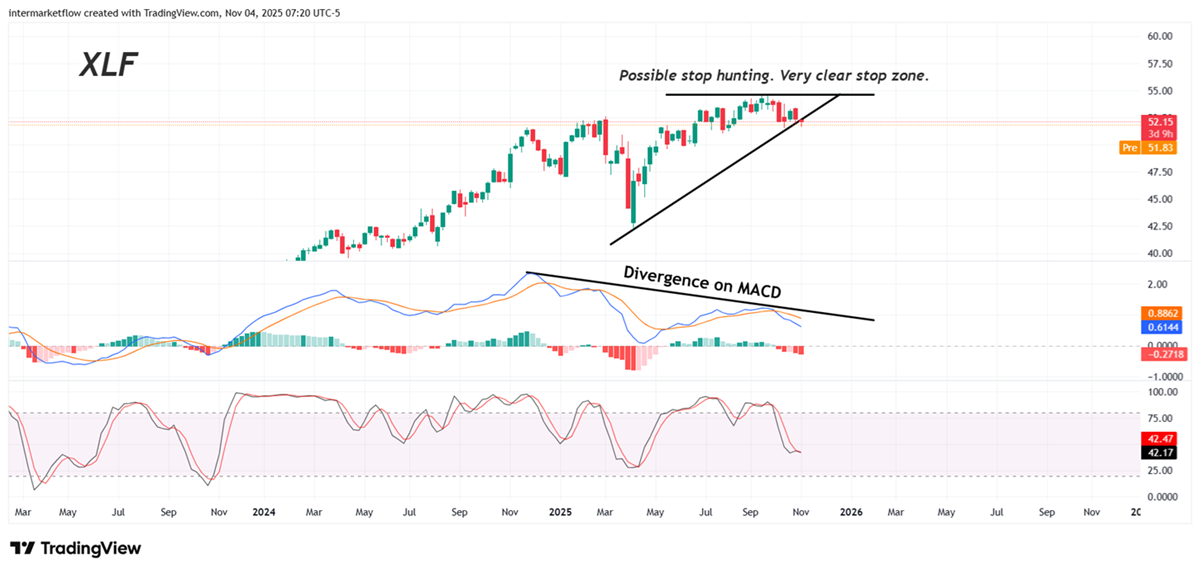
From a purely technical standpoint, it’s right on the verge of confirming. We’ll look for other technically confirmed vehicles to improve the probability of success.
XLF: The most beaten-down individual stocks
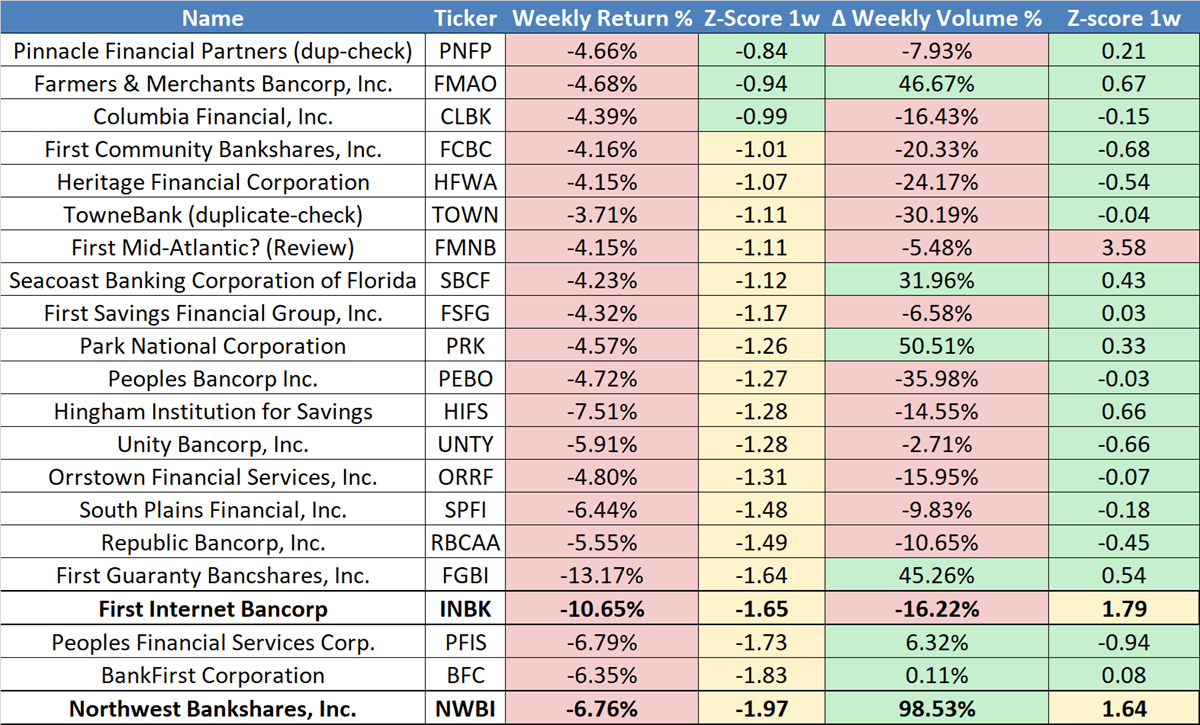
Extreme concordances and divergences between volume and return within our macro and intermarket view are what guide us.
XLF: INWK- First Internet Bank Corp
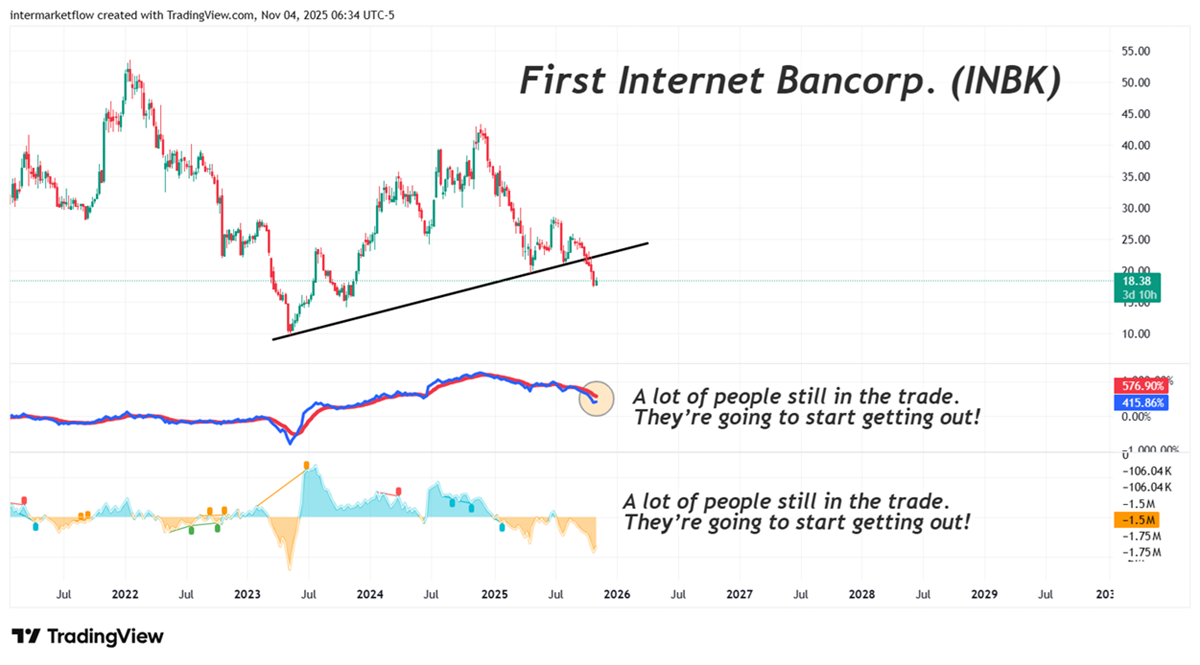
A very attractive chart, because the right read is that there are people in the trade starting to exit. We need people to still be in the trade — they’re the ones who will drive the drop.
Walking through the path of least resistance
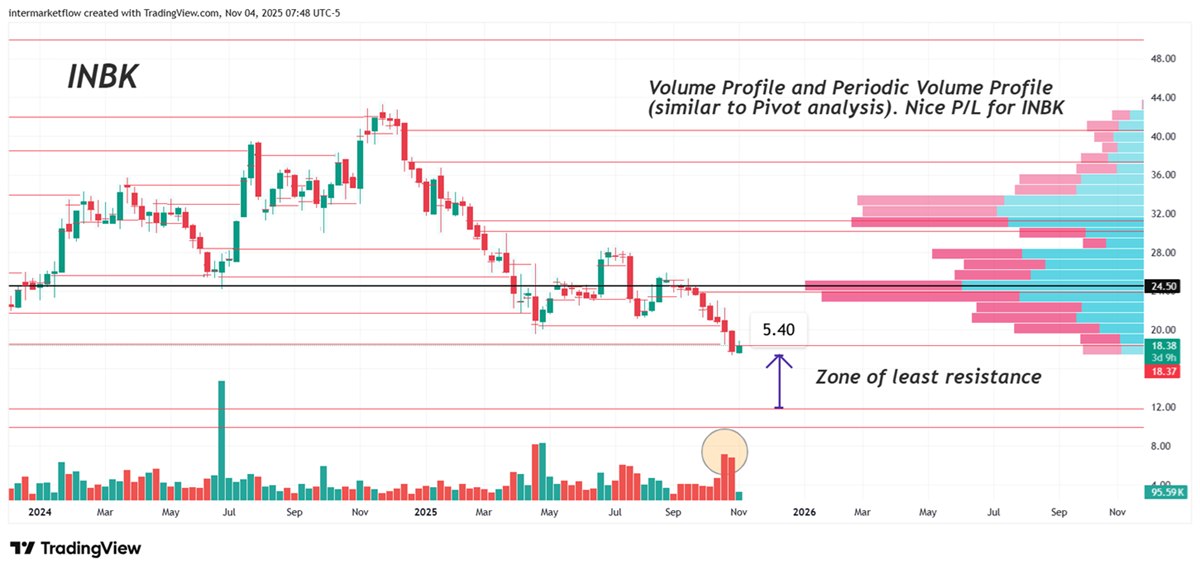
The volume profile by period—in this case, weekly—is very similar to trading with pivots. The difference is that pivots represent equilibrium levels from past periods that haven’t been broken. Red lines.
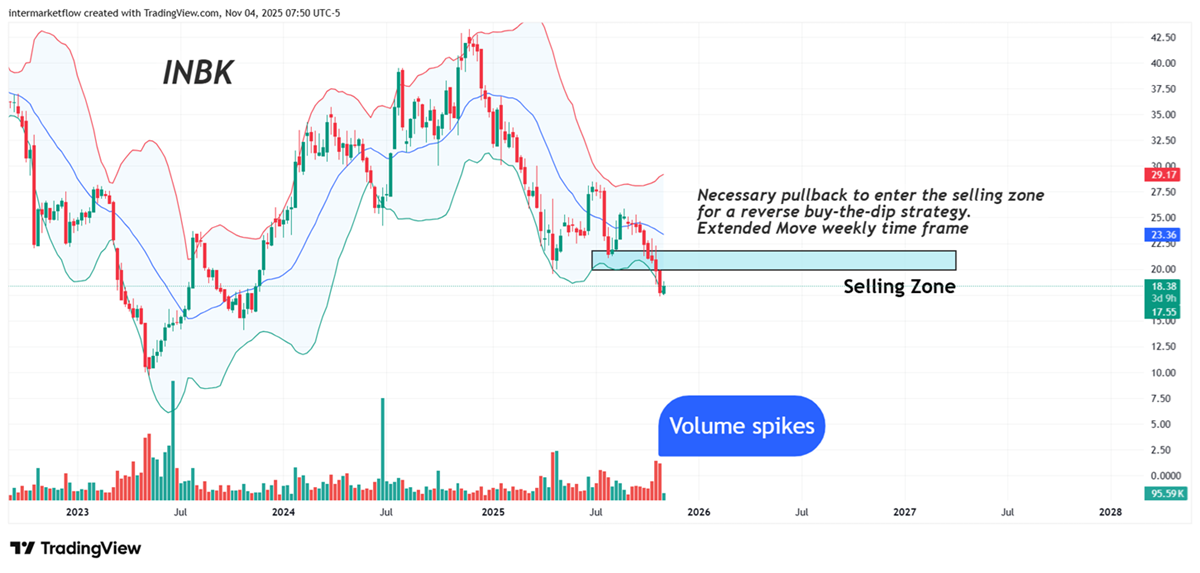
This stock is running — technically confirmed. It’s two standard deviations above its average volatility on both daily and weekly timeframes. Time to sit back and wait for the pullback, or at least a consolidation.
XLF and NWBI- Northwest Bancshares
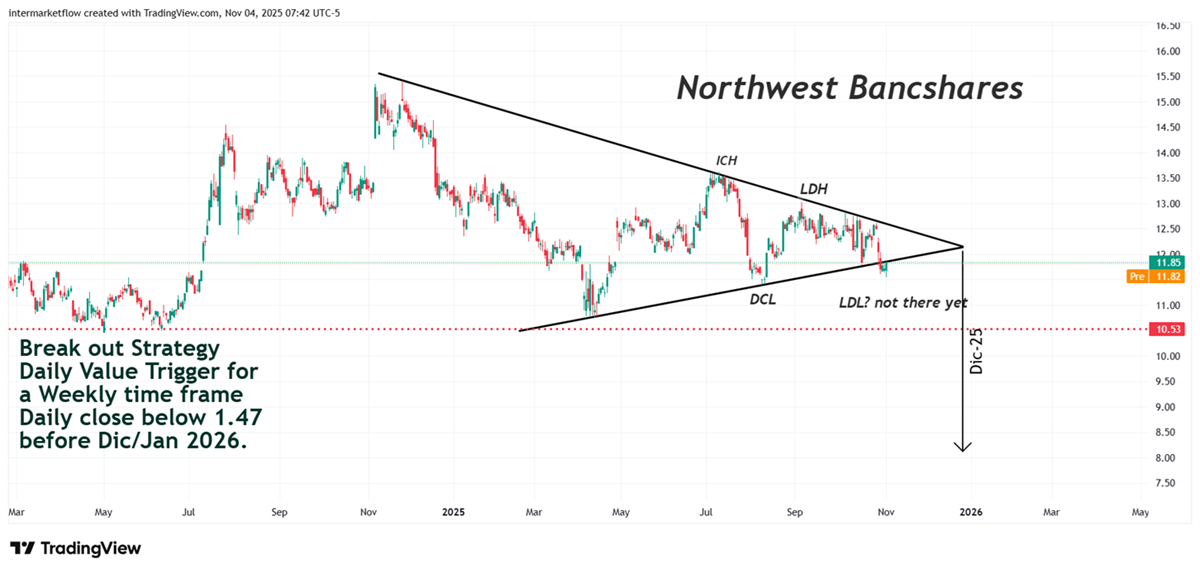
Beyond levels, popular chart patterns have the ability to limit your time window. This, for instance, is a key tool if you’re trading options.
For those trading breakouts, this is a chart to keep an eye on.
That’s all for the midweek. Use the stock list, follow the Z-scores — there’s value there. Lastly, these are not recommendations. This is part of our work, which we make public for marketing purposes.
Martin
If you believe this is an error, please contact the administrator.