Predicting next recession. Key Indicators of Imminent Rate Cuts. Signals and Lead Times
We have 4 market indicators pointing to a short-term rate cut as early as September 2024.
It is important to understand this setups reading macro arguments explain here.
• Market-assigned probability today: 93%, almost a certainty. • Start of the rate-cutting period by the F.E.D. • Yield curve inversion: The most popular of all. • The spread between 30-year rates and the Fed Funds. For us, the most important of the three. We develop and quantify all of these here.
Most likely date of recession:
Based on history and our measurements of the three indicators, our macro view contemplates the following scenarios:
- Most likely recession date between October 2024 and April 2025. We consider this the most probable because it is the time span where all three indicators overlap.
- Dates between April and October 2025 come with lower probability because only two of the three indicators converge.
- Beyond October 2025, we would be facing a new case relative to recent history, something we see as unlikely.
Macro view
We expect rate cuts across all segments of the curve but start trading the short end that “would” have a certain start date.
Within this macro view, we subdivide into two scenarios:
A. Short-term rate cut in a Risk-Off scenario with a decelerating economy heading towards a recession. Our main hypothesis. B. Short-term rate cut in a Risk-On scenario with an economy avoiding recession, achieving a "soft landing."
In both scenarios, the directly affected assets are:
- Non-yielding assets: Commodities, Gold, and Bitcoin or any other trading in the secondary markets.
- Assets that generate/need short-term cash flows: Short-term bonds (from various issuers) and specific stocks.
These assets may or may not be within the American economy.
- Risk-Off Scenario – Decelerating Economy Heading to Recession. Our Macro View.
Commodities
Excellent vehicles to diversify currencies and therefore economies, to operate during recoveries or global recessions, to hedge against inflationary pressures, risks in the Dollar, and in some cases as safe havens.
General list:
- Energy
- Industrial Metals
- Precious Metals
- Agricultural Products
- Livestock Products
- Soft Products
We start with the one that hedges us against inflationary pressures, benefits from an interest rate cut, provides currency diversification, and acts as a safe haven. All characteristics align with our macro view and portfolio needs
Gold
Before starting, a general overview of this asset with nearly 200 years of quotations. Gold is an asset that provides protection against excessive growth of M2, geopolitical risks, currency diversification, and more.
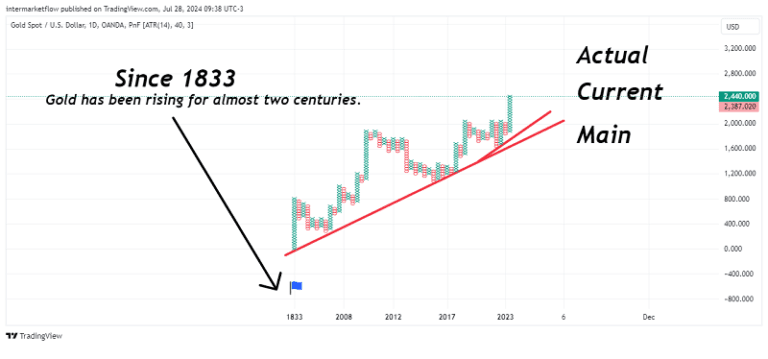
As we seek to operate, we are narrowing down the “forest.” A priori, it is in a long upward trend. The central risk here is overextension with its consequent reversion to the mean.
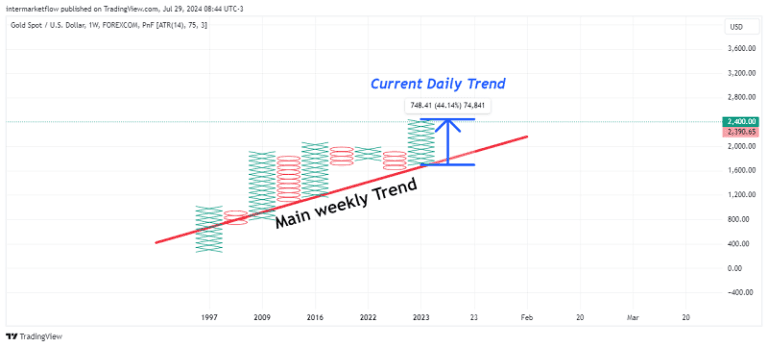
Current Trend
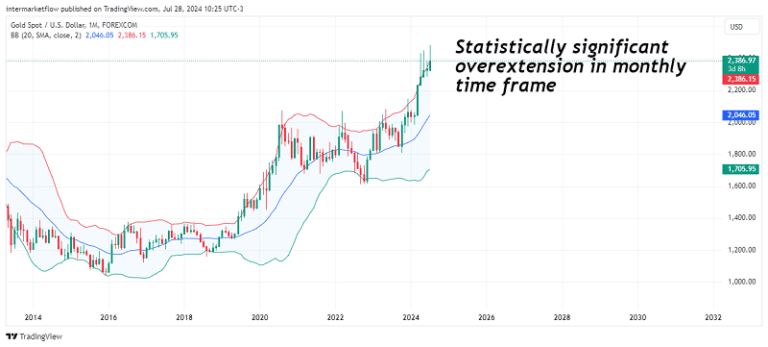
Reversion to the mean. Monthly time frame.
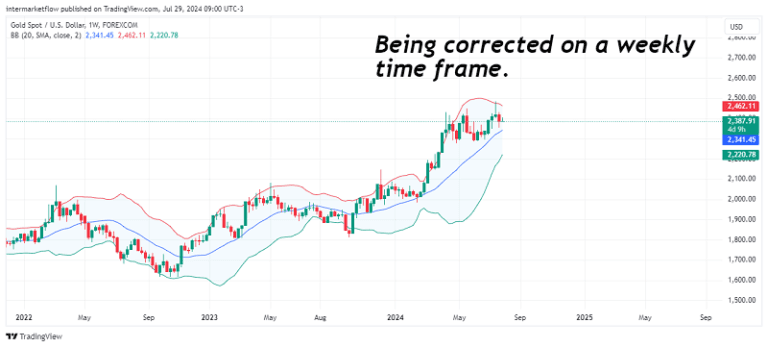
Reversion to the mean. Weekly time frame.
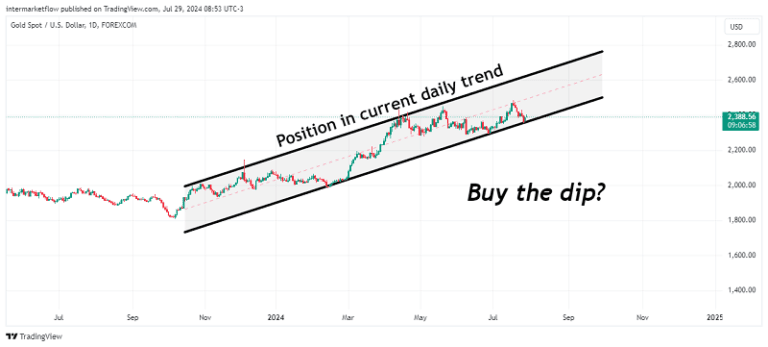
Reversion to the mean. Daily time frame
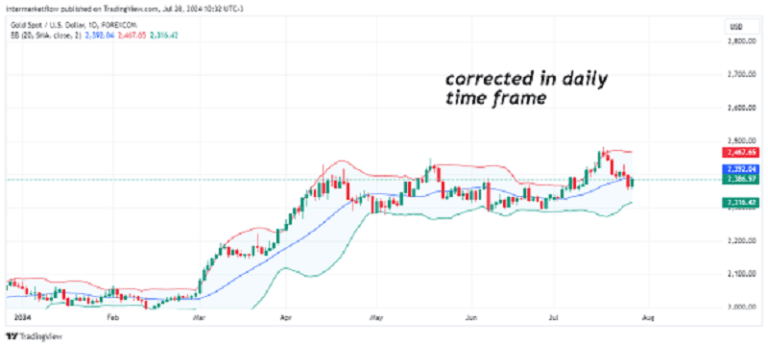
Both the weekly and daily corrections are occurring with a consolidation process between very defined and “high” values on a monthly level. There are buyers and sellers, but there is no massive exit of buyers, allowing the price to stabilize at those levels.
Pure Chartism: Confirmed wedge defining the timing of the operation.

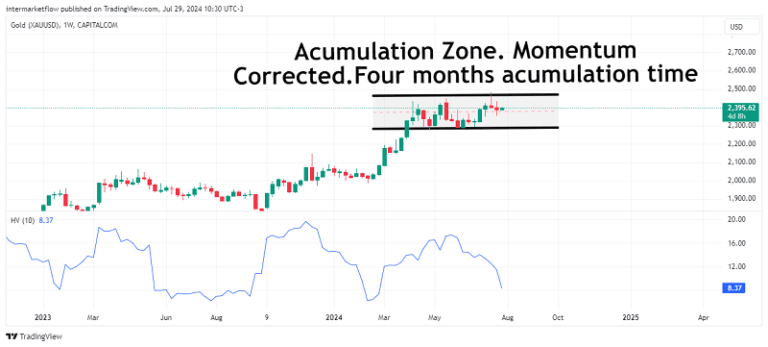
Momentum
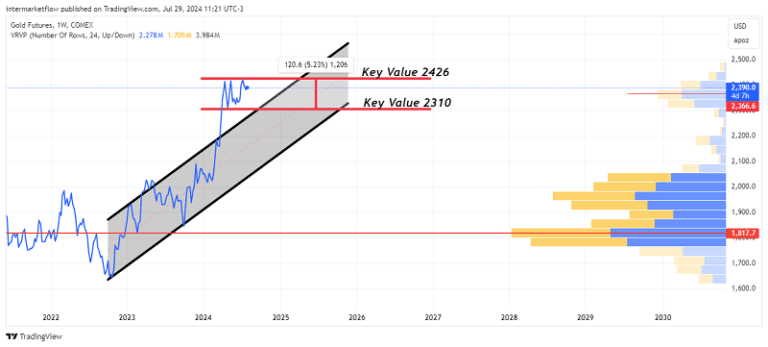
Key Values - Market Situation
We need to go to the futures market to get a proxy of volume and volume profile.
The first upcoming expiration clearly shows the consolidation process at values above the channel. Buying and selling occur, but there is no massive liquidation, establishing an accumulation zone.
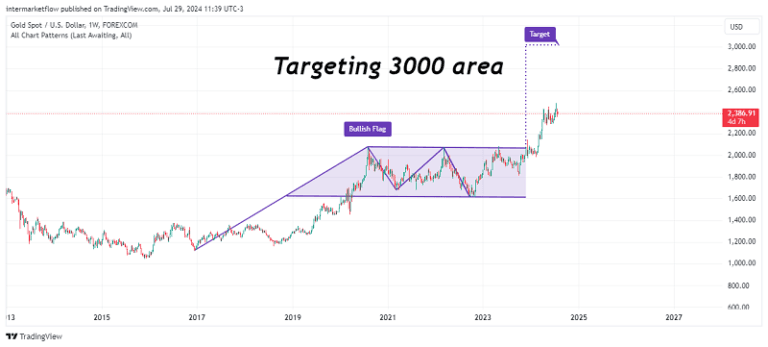
Targeting
A
B

Macro Targeting
History shows that the peaks are found halfway through the rate-cutting cycle.
Depends on timming the cuts in time and absolute value. Implicit probabilities in futures markets play a key role
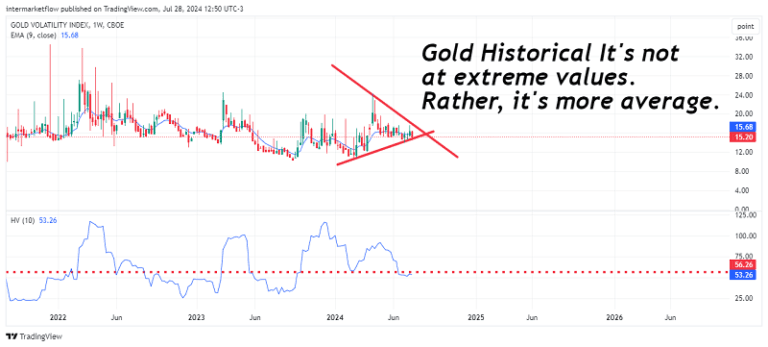
Volatility
Traiding Options
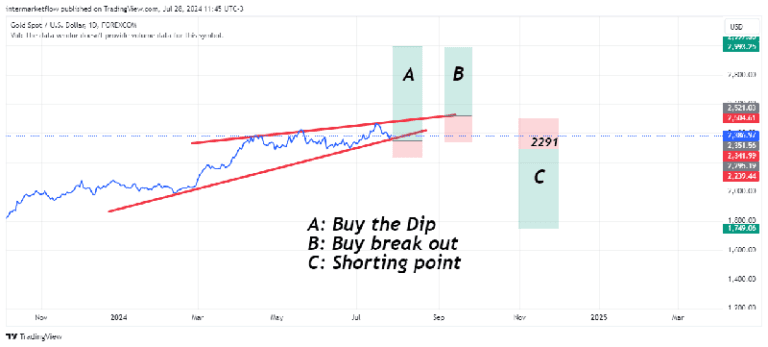
There are always two directions to trade. Technical analysis shows you where and when. The macro view indicates the direction. If we are wrong, C is the setup to short gold.
Thank you for reading this far. I hope you enjoyed it as much as I enjoyed writing it. Remember, these are not trade suggestions. It is simply what we do and publish for marketing purposes. Subscribe, share, every bit helps and is appreciated. Subscribers gain access to an additional level, where there are more substantial vehicles and setups, both in quality and quantity.
Take care in the markets. Remember that we are small fish swimming in a shark-infested sea. See you soon.
Martin

Unlock Full Access
We create professional content for traders, based on intermarket, macro, technical, quant, and flow analysis.
Welcome aboard — enjoy the ride.
If you have already registered before, please enter your email again to recover your session.