Price is rising—but participation is not. Neither in the U.S. nor globally.
We expanded the scope beyond equities and shifted to a monthly timeframe to isolate the underlying structure. What emerges is not a healthy rotation—it’s a liquidity vacuum.
#1 Risk Vector — Liquidity Trap
Equity volume (-2.22σ) and bond volume (-1.89σ) confirm it: there is no capital validating current price levels.This is not accumulation. This is distribution.
Signal
Price advancing with collapsing volume across equities and bonds.
Validation:
Real capital flows (Dollar value of transaccions , Z_DV, and rel volume, Z_VOL, are deeply negative.
Reading
Short-term flows (derivatives, systematic) are driving price.Real money is not participating.
Implication
This is a liquidity trap.At these levels, there is simply no capital inflow.
Action
Sell rallies—not buy dips. Until volume returns, upside is not structurally supported.
#2 Risk Vector: US02Y Sensitivity — Short Rate in Control
Short-term rate sensitivity is accelerating, with a twofold increase this month relative to the prior three-month period.
Signal
QQQ / SPY showing extreme negative correlation over 4W (-1.98σ / -1.76σ). Equities trading as an inverse proxy to the 2Y.
Validation
4W vs 12W acceleration confirms rising—not stabilizing—sensitivity. Exposure to 2-year yields is accelerating sharply, nearly doubling last month versus the prior three-month period.
Reading
This is not equity-driven price discovery.
The 2Y is dictating valuations through rate sensitivity.
Implication
Markets are now fragile to Fed and inflation prints.
Action
Watch the 2Y—not equities. That is the control variable.
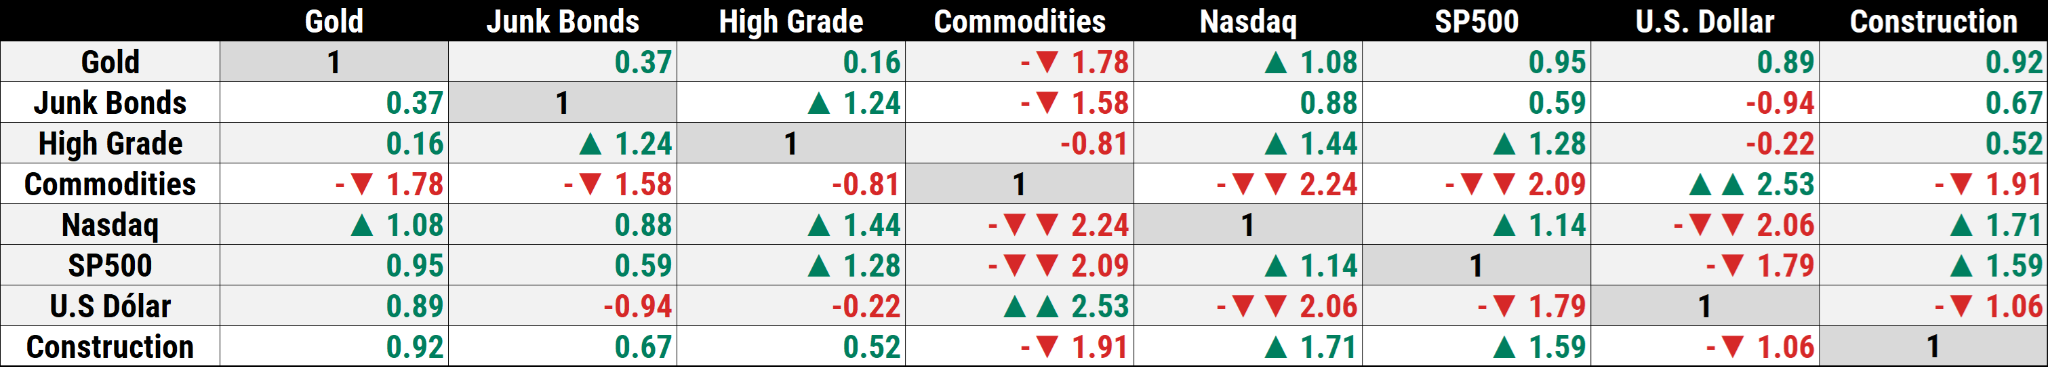
#3 Risk Vector: Cross-asset correlations across asset classes.
Signal
Commodities vs Nasdaq divergence (-2.24σ).
Validation
USD–Commodities moving together (+2.53σ). The core pillar of intermarket analysis is positioned at extremes opposite to what the history and empiric evidence shows us.
Reading
Intermarket causality is breaking.In a normal cycle growth and inputs move together.Today: they diverge aggressively.
Implication
This is not growth—it’s a cost/currency shock. One side reflects demand destruction; the other, a safe-haven dollar draining global liquidity—a reinforcing loop that points directly to recession.
The signal is inherently global, as commodities are produced and traded globally, with pricing denominated in U.S. dollars
Action
Do not trust price in isolation. Trust cross-asset confirmation and volume—unconfirmed breaks are noise.
#4 Risk Vector — Volatility Regime
Volatility is elevated across all sectors.
This reflects:
Indecision
Thin Markets
lack of conviction
Absence of liquidity
A market trading at altitude—with no oxygen.
First Reactions — What Matters Now
This is not an environment to:
chase highs
trade upside breakouts
The bias is to fade dislocations to the downside—not chase the upside.
Signal
Price up
Validation
Volume and liquidity are both absent. While related, they capture different dynamics—volume measures participation; liquidity measures depth of market and execution capacity
Action
Wait.
What Will Trigger Opportunity
Breaks in key assets and their inter and intra market correlations
Confirmed by volume
Until then: everything is noise
Macro Regime Definition
Currency-Commodities-Inflation-Bonds -Equities. Thats the causality order
We are at the end of the cycle—the transmission from bonds to equities is in play
Today
The 2Y dictates everything. Price discovery is no longer inside the asset.It is imposed externally.
Final Block — Decision Zone
This is the inflection point.The slowdown is already visible.
That is not the question.The question is:
Does it become a credit event—or something bigger?
This chart defines credit risk
High Grade Bonds defines systemic risk
Trade Framework
Methodology
We track capital flows—not price.
We analyze their origin and project their path by measuring flows and returns, normalizing volume and volatility across assets, and benchmarking current correlations against history.This framework transforms data into actionable trading decisions.
Price is rising—but no real capital is behind it.
This is not a bull market. This is a liquidity vacuum.
We are one level away from a regime shift: