Here you will find
- A macro reading of the S&P 500 index
- Which companies are driving the index, which sectors, and what type are they?
- The intermarket consequences this situation is generating.
- Liquidity—a simple explanation and how it’s affecting valuations.
- Conclusions about the message the market is sending.
- The budget constraints that are starting to surface—and where the pressure release valve might emerge.
- Today’s trading arguments
- A simple technical setup with an excellent P/L
Macro reading of the S&P 500 and its sub-indices
Each sub-index of the S&P 500 reflects the situation of different types of companies.
When analyzing the S&P 500 from a macro perspective, it’s essential to go beyond the index level and dive into its underlying sectors. Each sub-index reflects different parts of the economy—cyclical, defensive, interest-rate sensitive, etc.—and reading their relative performance helps anticipate where capital is rotating, how macro expectations are evolving, and what stage of the cycle we’re likely in.
Is the S&P 500 reflecting the real economy?

Yes, it’s at all-time highs—but why?
S&P 500 Big Caps ex-Magnificent 7
Even when excluding the Magnificent 7, we’re still seeing a new high. So, it’s not just a tech story—it’s broader, driven by size and strong capital structures, Tecs and Financials specially.

S&P 500 Equal Weight
Once you equal-weight the index, the breakout fades. No new highs here—so far, it’s a failed breakout.

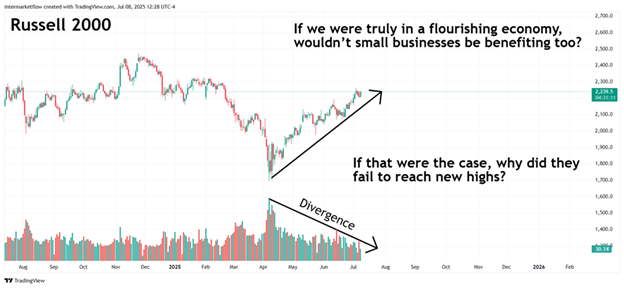
S&P 500 Small Caps
No new highs for small caps. Technical analysis is a very useful tool—especially when focusing on volume and its various interpretations. A proper reading provides a wealth of information.
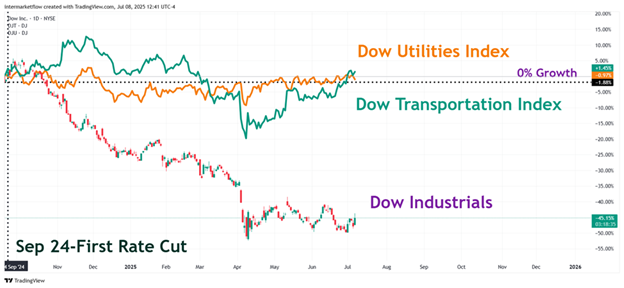
S&P 500 vs. Dow Indices
This chart shows growth in each index since the first rate cut in September ’24. The black dotted line = 0% growth. The Dow index has lost relevance over time. However, seeing industrials in negative territory—being leading sectors of the cycle—adds another piece to the puzzle.
Intermarket interpretation of the current situation
S&P 500 and the Dollar
All of this is happening with rates at 4.25%-4.5%, and the dollar weakening despite attractive carries elsewhere.

It’s already clear what adjustment variable this administration has chosen—not just based on what’s happening, but on what they’re aiming for, like a sharp rate cut. The dollar isn’t holding up even with high rates, so it’s not hard to see what would happen if they drop further.
S&P 500 and the Real Economy


Once again, we turn to technical analysis. The pattern we’re seeing is a bullish consolidation. It hasn’t been confirmed yet, but it should be soon, based on the timing suggested by the crossover of the accumulation lines.

A leading sector in expansionary cycles—no new high, not even close.

There’s a new high, but it doesn’t have the strength we’re seeing in the tech sector. We know that the big banks are hitting new highs—but we also know that small banks are in trouble.

Summary
The S&P 500 is hitting new highs, driven not only by tech but also by Big Caps—firms with stronger capital structures, more resilient to high rates and local slowdowns. Don’t forget: 60–65% of S&P 500 revenues come from abroad.
A weak dollar is a tailwind for overseas revenues.
Small caps are struggling. Failed breakouts, weak technicals, and no external sales to cushion prolonged high rates.
Sectors are behaving as they would in a slowing—or already recessed—economy.
This administration has already chosen its adjustment variable: the dollar. Naturally, this has a direct impact on trading.
S&P 500 and liquidity, explained simply.
Liquidity is often misunderstood. Fiscal deficits inject money directly into the economy without immediately burdening household balance sheets. These liabilities hit the state, not consumers—at least not right away. Later, they’ll show up as inflation.
Liquidity enters mainly through M2 expansion or fiscal deficits. Foreign investment is a third channel, but we’ll leave that aside.
QE? Whether it’s inflationary is still debated. But what QE does is incentivize large banks to buy Treasuries over holding reserves. When paired with fiscal deficits, it becomes a liquidity machine. That said, QE isn’t required—deficits alone can do the job.With a stronger inflationary effect.
If we were in a true economic expansion, small caps would outperform big caps. Cyclicals would beat defensives. That’s not what’s happening. The economy isn’t booming—it’s being inflated.
Budget constraints are mounting (rates, interest payments, consumers taking on more debt, and delinquency rates rising across all types of credit).
Furthermore consumers are seeing long-term yields rise for the wrong reasons: rising inflation expectations and term premium.
S&P 500 and this situation
Yes, it can continue—but not indefinitely. Eventually, natural budget constraints will show up. It could happen through weaker consumption, unsustainable banking conditions, lower corporate profits, or simply a market correction that reflects all of the above.
S&P 500 and Our Trades: Vehicle Selection key factor.
Short trades vs the SP&500—hi-beta and tech—got stopped out.
Short trades vs S&P 500 — via small caps, regional banks—held up better, still running at breakevens levels or near them. Expecting with confidence.
Today’s trading arguments
Defensive sectors.
Dollar weakness and its effects on commodities.
We’re experiencing a segmented market—between large and small caps on one hand. Inflated by constant liquidity injections. At all-time highs, while the real macro cycle is slowing down or already in recession. This is irrational. But as we all know, the market can stay irrational longer than one can stay solvent.
Simple Set up
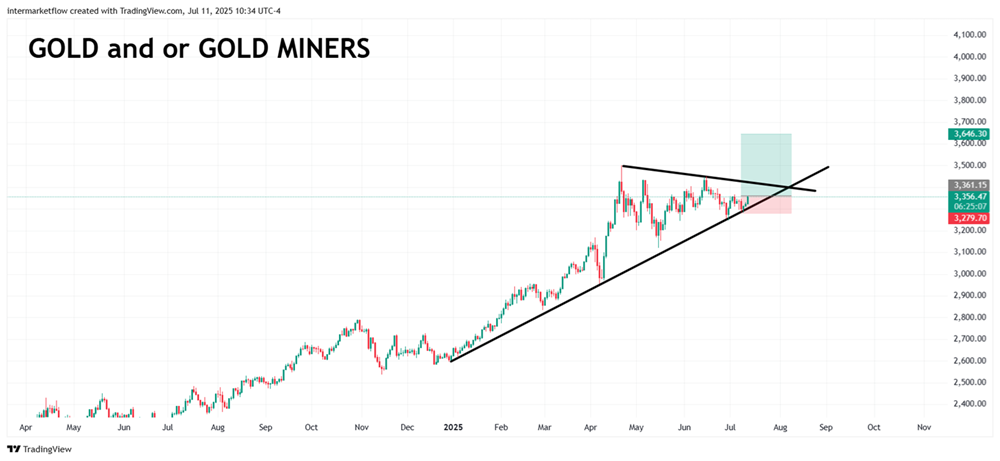
The macro support is solid. However, what triggered this trade is that we’re not seeing any bearish pressure on this asset until the December options contract—historically a point of high interest, and currently trading well above the max pain value.
Well, that’s all for today. As always, the technical setups we’re studying are in the next blog article. For the 10,000th time, this is what we’re seeing and sharing for marketing purposes. THESE ARE NOT TRADING RECOMMENDATIONS.
You can find us at intermarketflow.com and on X @intermarketflow.
See you soon,
Martin
If you believe this is an error, please contact the administrator.