#52 Micro and Small Caps: valuations across and within sectors
Small Caps play a key role in the business fabric of the economy, both as job creators and as producers of goods and services
A common mistake is to associate the state of the real economy with the S&P 500. Mass media focus their coverage on the most well-known stock indices—S&P 500, Russell 2000, Nasdaq 100, Dow Industrials, and so on. The companies in these indices are publicly traded and therefore required to publish their financial statements.
This, of course, doesn’t reflect the reality of the broader economy.
Small Caps: job creators and backbone of the country’s business base
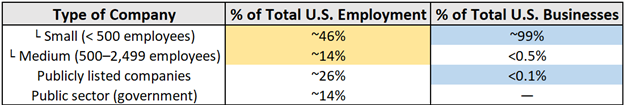
They account for 46% of total employment.
They make up 99% of all companies in the country.
Publicly listed companies represent 26% of employment and less than 0.1% of total businesses.
Small Caps: share of GDP and foreign trade (X – M)
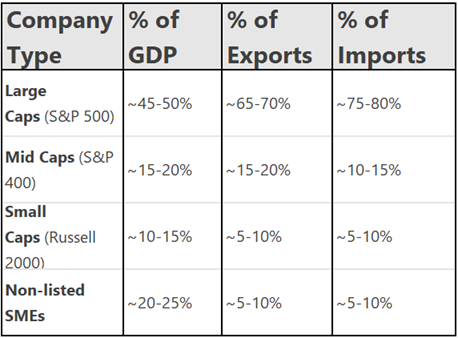
Small Caps, both listed and unlisted, generate between 30% and 40% of GDP.
Their combined share of foreign trade ranges from 10% to 20%.
Regardless of listing status, Small Caps rely almost entirely on the domestic economy—making them highly exposed to the local macroeconomic cycle.
Big Caps vs. Small Caps: a historical perspective
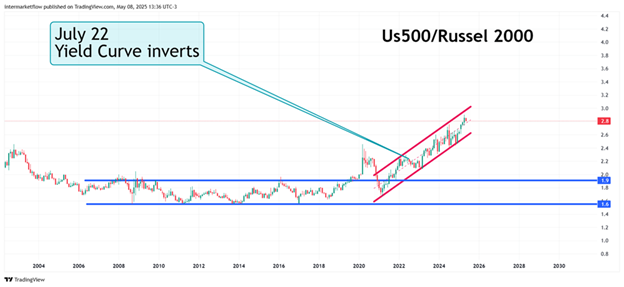
The shift toward large companies is at levels well above those seen during the G.F.C., and the trend is still growing.
Big Caps vs. Small Caps: current trend
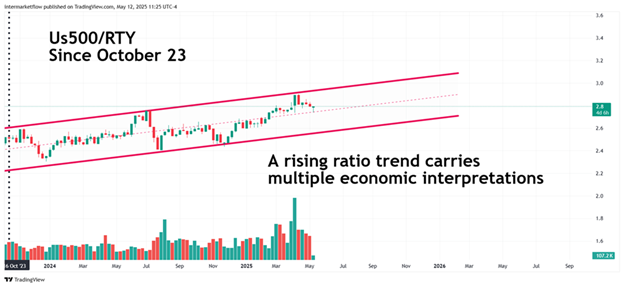
The upward trend continues, and market concentration keeps increasing.
Big Caps keep gaining in value, attracting significantly more capital than Small Caps.
Small Caps: sector rotations relative to Staples and size-based valuations by sector since October 2023
The starting date is no coincidence. It marks the peak in real interest rates and the beginning of their decline.
Financials/Us500 vs Staples/Us500
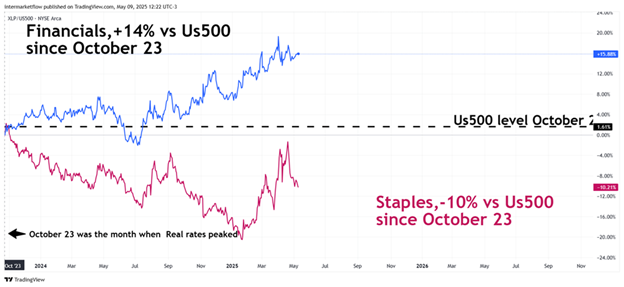
The Financial sector as a whole did not rotate toward more defensive sectors.
Nevertheless, defensive sectors show an upward trend.
Intrasector valuations: Small Cap Financials/US500 vs. Big Cap Financials/US500
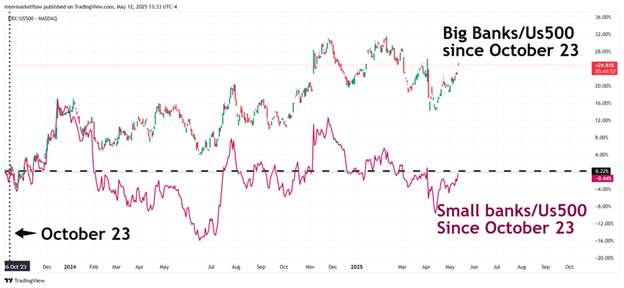
When breaking down between Small and Big Cap banks, the picture looks very different. Small Cap banks have experienced capital rotation and have underperformed the S&P 500 since October 2023.
Big Banks, on the other hand, have seen little to no rotation—this could suggest they are lagging.
We’ve seen the challenges small banks are facing regarding loan delinquencies, especially in credit card lending.
Discretionary/Sp500 vs Staples/500 since October 23.
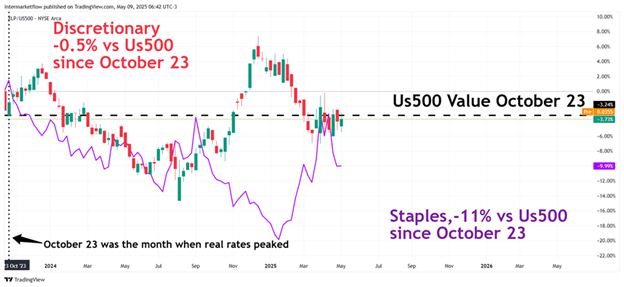
Small Cap Discretionary / US500 vs. Big Cap Discretionary / US500
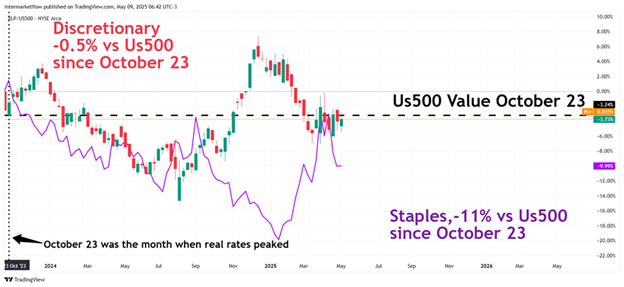
This sector had already been rotating even before October 2023, with a brief rebound that was quickly corrected.
Capital rotation in the sector has been strong.
The spread relative to defensive sectors has narrowed.
Once again, Small Caps in this sector have corrected much more.
Small Caps are exposed almost entirely to the domestic market, while Big Caps tend to have both local and international exposure.
Techs / US500 vs. Staples / US500 since October 2023
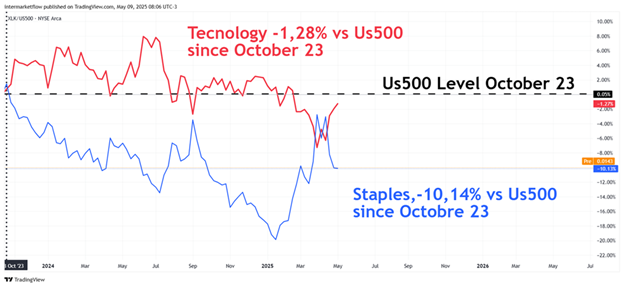
The sector as a whole has rotated toward more defensive sectors.
Small Cap Techs / US500 vs. Big Cap Techs / US500
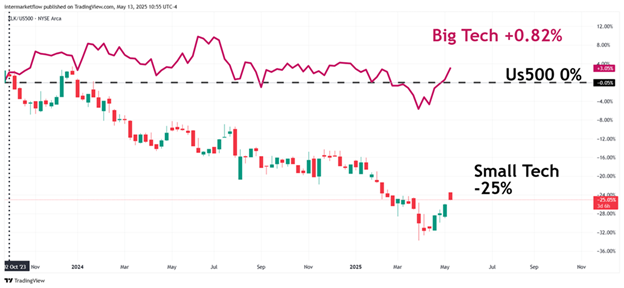
There’s once again a clear difference between Small Cap Techs and the larger ones.
Industrials / US500 vs. Staples / US500 since October 2023
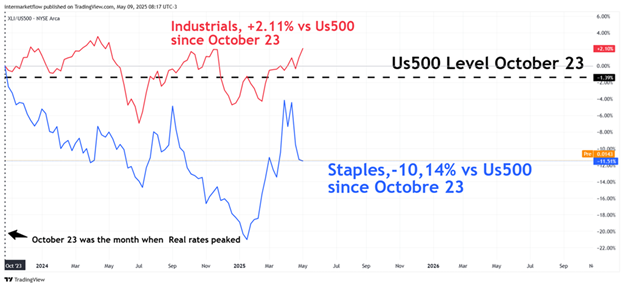
The industrial sector has been moving sideways with almost no growth since October 2023.
It’s losing value relative to defensive sectors.
Small Cap Industrials / US500 vs. Big Cap Industrials
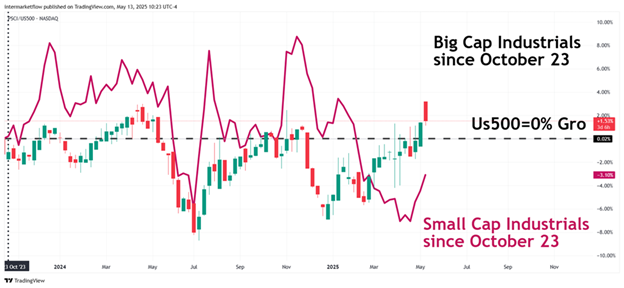
There are differences between Small Cap and Big Cap Industrials, but the sector as a whole has been hit hard and has shown no growth since October 2023.
Summary
All sectors have been rotating toward more defensive ones, except for Financials.
When breaking it down by size within each sector, Small Caps are consistently hit harder by this rotation.
Among the Big Caps analyzed, the only group that hasn’t yet seen capital outflows are the Big Banks.
Small Caps: possible macro interpretations
Restrictive or uncertain macro context
High interest rates, limited credit access → Small Caps suffer more.Investors seek refuge in large, global companies with solid margins.
Structural risk aversion
The gap reflects fund preference for firms with international exposure, cash generation, pricing power, etc.Small Caps are more dependent on domestic consumption, financial costs, and local cycles.
Market concentration
The S&P 500 is dominated by a small group of companies (tech, AI, growth).The ratio reflects this hyper-concentration rather than broad-based growth.
It’s a clear risk-off signal
Another one among the many we’ve already seen—both macroeconomic and intermarket in nature.
Small Caps, equity capital, and intermarket analysis
Equity capital doesn’t have many places to go:
It can’t move into long-duration bonds due to inflation expectations and perceived risk.
It seeks refuge in gold. Former safe havens—especially alternative fiat currencies—no longer offer the same protection.
Commodities are affected by current global uncertainty and expectations of a global slowdown. This is already priced in.
The best hedge is in companies with pricing power, presence in both international and local markets, no idiosyncratic risk, and strong inflation defense.
By elimination, large caps have become one of today’s new safe havens. Not just for American citizens, but for investors around the world.
Trading in this context: vehicle selection, timing, and potential setups. These are the questions we need to answer.
P.S.
If you’re interested in this topic and ready to take the next step…
Here’s how to go deeper:
We’ve designed subscription tiers for every stage—whether you’re actively trading or just starting to navigate markets and the economy.
Observer Tier – Free Subscription for a free trial below!
Perfect if you’re looking to learn, build structure, and gain clarity. You’ll get access to advanced tools, frameworks, and real-world examples to decode the big picture—at no cost.
If you’re enjoying this content, keep in mind that the next level—Explorer—includes more than just theory. It gives you access to real setups: the vehicle, entry and exit points, and the full Macro, Intermarket, and Technical justification behind each trade.
You’ll also get occasional deep dives focused purely on theory: economic models, intermarket logic, and the full range of technical analysis approaches.
You can start now (subscribing below) with a 40-day free trial—no credit card required. After that, subscriptions are monthly and you can cancel anytime with 48 hours’ notice.
And don’t miss our updates on X.
We regularly share insights, setups, and tools to help you think like a trader—even if you’re not one (yet).
Enjoyed this article? You’ll find more like it on our blog.
See you there,
Martin
Intermarket Flow
If you believe this is an error, please contact the administrator.