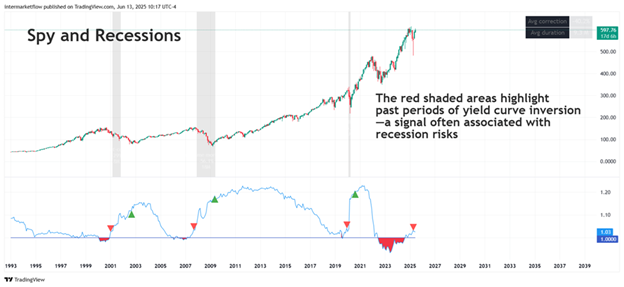
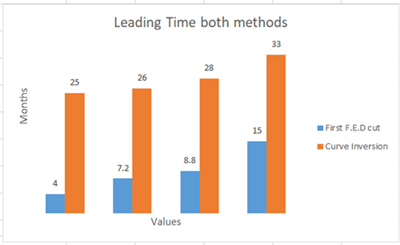
That projects the timing to June 2025.In other words, right about now. The maximum lead time was 15 months, which sets December 2025 as the latest possible date.
The yield curve: First Cut Historic Perspective

We line up the timeline using both methods

The yield curve Leading time using Averages
Stay with me on this.If both interpretations hold a 100% success rate based on previous recessions, then the time window to hold that condition runs from June 2025 to December 2025.
Outside that window of time, the condition no longer holds.
Of course, this is assuming that history repeats itself. Obviously, we know that’s not the case, but we also know that it always rhymes with the past.
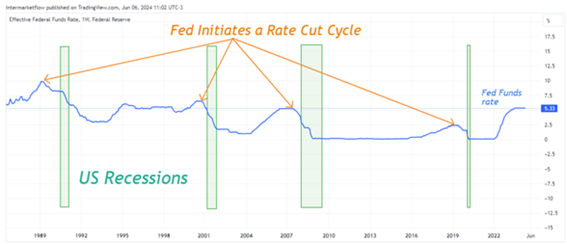
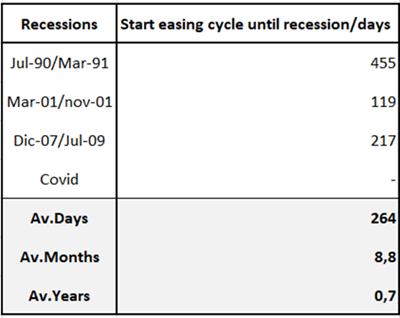
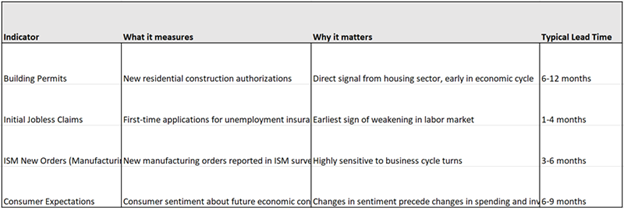
Causality: The curve and other leading indicators

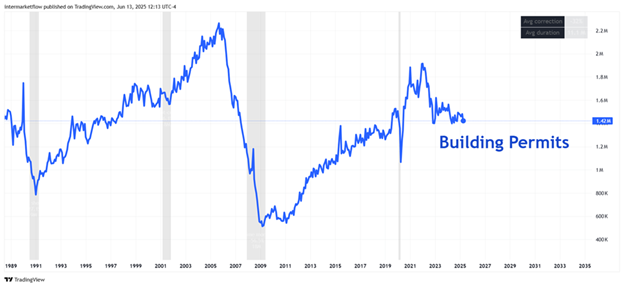
The yield curve and Building Permits – Gray areas mark past recessions

The rise in interest rates for the construction sector is likely where the effect is most visible across the economy.
An increase in short-term rates slows down construction loan applications. It’s simple common sense – higher borrowing costs directly eat into builders’ margins. A sufficiently large rate hike can literally halt construction, consuming all profitability. Of course, this is a gradual process; not black and white, but a gray area that darkens as rates climb.
Now consider long-term rate increases. Here, the impact comes through demand. More expensive mortgages reduce housing demand, which eventually affects supply through price adjustments. Economics 101.
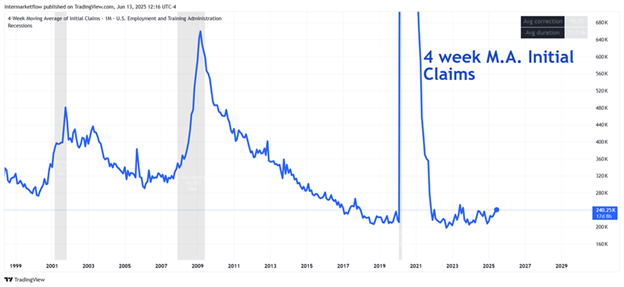
The yield curve and Initial Jobless Claims (4-week average) – Gray areas mark past recessions
Continuing with the example above, as production stalls, unemployment in the sector rises. In this specific case, the variable is reflexive—it shifts from white to black almost instantly. Higher unemployment directly translates into lower consumption, which in turn generates even more unemployment. In an economy where 70% relies on consumption, this sends joblessness skyrocketing at alarming speed.
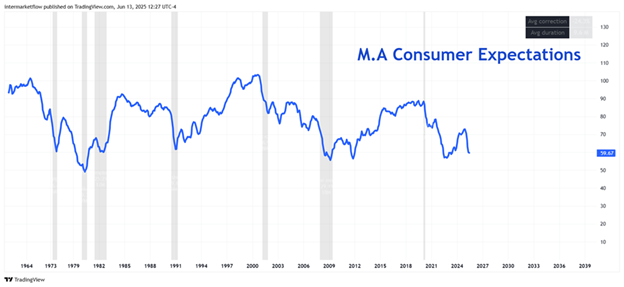
The yield curve and Consumer Expectations – Gray areas mark past recessions
Consumer Expectations and the Rate Hike Paradox…..
You can read the full version by subscribing below. This gives you access to the site and a free trial of 4 episodes. No credit card required.
You can find us at intermarketflow.com and on X @intermarketflow.
See you soon,